| Issue |
A&A
Volume 557, September 2013
|
|
|---|---|---|
| Article Number | A130 | |
| Number of page(s) | 60 | |
| Section | Extragalactic astronomy | |
| DOI | https://doi.org/10.1051/0004-6361/201220515 | |
| Published online | 20 September 2013 | |
Online material
Properties of the spectral template stars observed with PPak.
Appendix A: Notes on individual galaxies
IC 43. High quality kinematics. Significant bulge with second highest bulge-to-disk ratio (B/D = 0.32). Gas rotation curve rises quite sharply. A small bar and significant spiral structure are visible morphologically but exhibit little kinematic influence.
NGC 234. High quality kinematics. PPak and SparsePak data studied in detail in Paper IV. Strong, three-arm spiral structure with minor streaming motions. Some [Oiii] spots are clearly associated with star formation in the south-west arm.
NGC 575, IC 1710. Strongly barred galaxy. Bright field star within the PPak field-of-view. A Type-II break exists in μK(R) at roughly 1hR (approximately the same as the bar length). Very patchy [Oiii] emission. Stellar rotation curve shows interesting structure within 1hR.
Very patchy [Oiii] emission, some of which is associated with the visible spiral arms. “Ringing” present in μK(R) associated with the azimuthal coherence of the tightly wound spiral arms. “Kinematic flaring” starts just beyond 1hR. Host to Type Ia SN 1999dk (Modjaz & Li 1999).
IC 193. High quality kinematics. Sc galaxy, rather typical of our sample, apart from the high inclination (iTF = 39°). Rather weak [Oiii] emission. A dip in the [Oiii] rotation curve occurs at ~1hR without a morphological counterpart.
IC 208. Poor [Oiii] data. A Type II break in μK(R) occurs at ~1hR with a corresponding dip in the [Oiii] rotation curve; any dynamical association between these features is unknown. “Kinematic flaring” begins at about 2hR.
Unique among our sample: It has the lowest luminosity, MK = −21.0, one magnitude fainter than the second least luminous galaxy (UGC 3701). Two Type II breaks exist in μK(R) (at ~23″ and ~60″), but no indication of a bulge component; inner break is caused by the spiral arms. Appears to have a rather large bar, as well. Data within  (indicated with a dotted vertical line in the Atlas) are excluded in the analysis of σLOS and σz, to avoid beam-smearing affects particularly strong in the center. Rather constant σLOS with radius such that hσ,z/2hR = 2.5, an extreme value among our sample with only UGC 3701 having a larger ratio.
NGC 927, Mrk 593. Barred galaxy with a rather weak Type II break in μK(R) at ~1hR. Classified as a Starburst Nucleus Galaxy (SBNG), but its nucleus has an ambiguous activity classification between H 2 and LINER (Contini et al. 1998). Strong [Oiii] emission near the galaxy center and associated with the spiral arms.
Since the bulge/disk fitting routine resulted in a non-existing bulge, the excess light in the central region is interpreted as an inner disk. As with UGC 1862, σLOS and σz data within are excluded from our analysis. Strong [Oiii] emission associated with the spiral arms. [Oiii] velocity dispersions are roughly the same as σLOS.
NGC 1642. Very close to face on with iTF = 14°. Nicely defined spiral structure but slightly lopsided. [Oiii] rotation curve rises more steeply than the stellar rotation curve then declines to approximately the same value at ~1hR. The μK profile breaks to a more extended disk (larger scale length) at R ~ 16″.
Second lowest surface brightness disk in our sample. Rather constant σLOS resulting in hσ,z/2hR = 2.9, an extreme value for our sample (see also UGC 1862). Some ringing in the μK profile due to the spiral arms. Rotation curves rise slowly.
Classified as Im by RC3 with low surface brightness. Bright field star just to the west of the nucleus. Stellar and [Oiii] rotation curves dip at ~1hR where the “kinematic flaring” begins. Rather low value of hσ,z/2hR = 0.6 measured.
NGC 2441. Host of Type Ia SN 1995E (Molaro et al. 1995; Quinn et al. 2006). Observations are dominated by ring-like structure, likely due to weak bar. Isovelocity twisting exists in the stellar velocity field. Streaming motions likely affect both the stellar and [Oiii] rotation curves. Very strong [Oiii] emission at the center likely indicates an active nucleus.
High-quality kinematics. Well-defined three-arm spiral structure. Type II break in μK(R) at R ~ 20″ accompanied by a drop in the [Oiii] velocity dispersion. Bright field star toward the north-east.
NGC 2532. Two close companions ~4′ to the north connected by an Hi bridge (Martinsson 2011). Interaction has likely produced the bright arm toward the east and the lopsidedness of the galaxy. High star-formation rate with very bright [Oiii] emission associated with visible star-formation regions. Stellar and [Oiii] rotation curves have dramatically different shapes; the [Oiii] gas is likely effected by streaming motions.
NGC 2575. Highest inclination in the sample (iTF = 45°) with two bright field stars within the PPak field-of-view. High-quality stellar kinematics. Two Type II breaks in μK(R), one at R ~ 16″ and the other at R ~ 30″.
Low-inclination galaxy (iTF = 13.8°) with a small apparent size and scale length (hR = 10″). Stellar kinematic data have limited radial extent, and the stellar rotation curve declines dramatically at R > 1.5hR, likely erroneously.
NGC 2599, Mrk 389. Earliest morphological type in our sample (Sa), with the largest bulge-to-disk ratio (B/D = 0.72). Some spiral structure visible at large radii, but very smooth morphology otherwise. Hi rotation curve declines from 350 km s-1 to 250 km s-1 (Martinsson 2011); [Oiii] rotation curve not well fit by a tanh model yielding large error on rs,OIII. Bulge dominates all stellar kinematic data; however, we fit an exponential to σLOS beyond R = 27″ (the dotted line in the Atlas). We find an outlying value of hσ,z/2hR = 0.4. [Oiii] velocity dispersion declines smoothly over all radii.
NGC 2649. Strong spiral structure affects μK(R). Bright field star visible to the north. High-quality stellar kinematic data. Weak [Oiii] emission in the center (resulting in aberrant isovelocity contours); very bright emission associated with the arms at larger radii. Rather extreme value of hσ,z/2hR = 1.8.
The most distant galaxy in the sample (Vsys = 12830 km s-1; D = 178 Mpc). Stellar kinematics limited to R < 15″; [Oiii] emission is rather extended. Type II break in μK(R) at R ~ 15″. Fourth highest bulge-to-disk ratio with B/D = 0.16.
Barred galaxy with rather low surface brightness. Poorest quality kinematic data in our sample (only one 3600s observation). Stellar-continuum S/N map shows that only fibers in the bar and spiral-arm regions have S/N > 1. Strong dip in μK(R) at R ~ 20″. Rather low value of hσ/2hR ~ 0.5. Stars rotate faster than the [Oiii] gas, violating asymmetric drift equation. Latter two comments should consider the quality of the data.
NGC 3982. High-surface-brightness member of the Ursa Major cluster. Very high-quality kinematic data. Host of Type Ia SN 1998aq (Hurst et al. 1998; Saha et al. 2001). Classified as a Seyfert 1.9 (Véron-Cetty & Véron 2006). Very strong [Oiii] emission associated with the nucleus and with the spiral arm to the south. Warped and lopsided extension to the Hi gas (Martinsson 2011); PPak kinematics are regular. Included in DMS pilot sample as presented in early publications (Verheijen et al. 2004; Bershady et al. 2005; Westfall 2009). Type II break in μK(R) at R ~ 1hR; σLOS transitions to a shallower slope at this radius. Large value of hσ,z/2hR = 1.6.
NGC 4195. As with UGC 3091, this barred galaxy has been modeled assuming no bulge; inner excess in μK(R) (R ≤ 8″) interpreted as inner disk. As with UGC 1862, we exclude from our analysis of σLOS (vertical dotted line in Atlas). Stellar kinematic measurements only reach R ~ 20″. Rather high value of hσ,z/2hR = 1.7.
NGC 4662. Weakest [Oiii] emission in our sample, particularly within R < 10″. High-quality stellar kinematics. Excluded σLOS data at R < 1hR (vertical dotted line in the Atlas) to remove bar-associated regions. Type II break in μK(R) at R ~ 25″. Fifth highest bulge-to-disk ratio, with B/D = 0.14.
NGC 4977. Early-type spiral (SAb). Third highest bulge-to-disk ratio with B/D = 0.24. Low-surface-brightness, extended disk with strong spiral structure not probed by our kinematics. Rather complex μK(R), transitions to a shallower slope at R ~ 10″, which may be an extent of the bulge not accounted for in our bulge-disk decomposition. Data within R < 15″ is excluded from our analysis of σLOS. Central velocity dispersion errors are large due to the few data points used in the fit. Weak [Oiii] emission in the disk yields a poor rotation curve. Strong [Oiii] emission in the center suggests an active nucleus.
Well-defined spiral structure affecting μK(R). High inclination (iTF = 40°) and high-quality rotation curves for both the gas and stars. Measurements of σLOS limited to R < 25″, whereas [Oiii] dispersions are largely beyond that radius. The [Oiii] emission associated with some bright star-forming regions.
High-quality [Oiii] data with many star-forming regions producing large EW [Oiii] emission. Stellar data has a limited radial extent. Weak morphological bar does not affect the kinematics. Shallower slope in μK(R) beyond ~1hR. Low value of hσ,z/2hR = 0.5.
IC 1132. Very nearly face-on (iTF = 12°) with strong spiral structure visible in μK(R). Bulgeless galaxy; as with UGC 1862, we exclude data within  in the analysis of σLOS (vertical dotted line in Atlas). Many [Oiii]-emitting star-formation regions associated with the spiral arms.
NGC 6691. Barred galaxy. Lowest inclination in the sample (iTF = 5.8°), yielding a very low-amplitude projected rotation curves. Type II break in μK(R) at ~1hR that matches a flattening of the σLOS profile. Strong [Oiii] emission near the galaxy center that may indicate an active nucleus.
NGC 7495. Stellar and [Oiii] rotation curves dip at ~1hR that may match a slight rise in μK(R), indicating streaming motion along a spiral arm. Type II break in μK(R) at R ~ 25″. Bright star-forming knots in the extended parts of the disk.
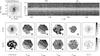
Appendix B: Atlas of Galaxy kinematics
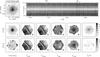
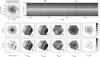
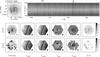
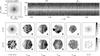
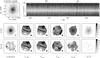
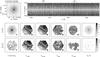
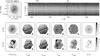
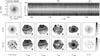
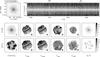
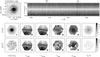
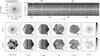
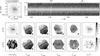
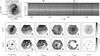
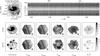
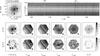
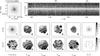
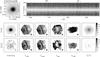
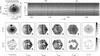
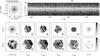
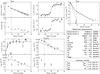
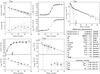
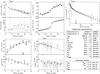
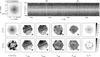
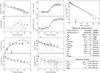
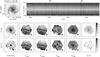
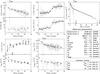
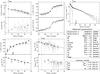
This Atlas presents a collection of the relevant photometric and kinematic data obtained for the 30 galaxies in the PPak sample, one galaxy per page. For each galaxy, the top half of the page displays two-dimensional images, whereas the bottom half shows the derived radial profiles and contains tables with relevant parameters.
Appendix B.1: Images
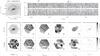
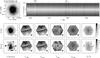
The two-dimensional images are organized in three rows: The left-most panel in the first row shows the optical image of the galaxy extracted from blue POSS-II plates, illustrating its morphology and giving an impression of its surface brightness. SDSS multicolor images are provided in Paper I. The elongated panel to the right of the first row shows the extracted, wavelength-calibrated, sky-subtracted and combined(+merged) galaxy spectra organized along pixel rows. Most images consist of 331 spectra (331 rows); however, five galaxies have more than 331 spectra due to spatial offsets between the different combined pointings (see Sect. 6.8.1 and Table 4). The spectra have been reordered in radial distance from the galaxy center. Toward the blue (left) spectral regions in this panel, the [Oiii]λ5007 Å emission line (position indicated above the panel) is readily visible, as well as the [Oiii]λ4961 Å line for most galaxies with recession velocities larger than 1500 km s-1. For distant galaxies (e.g., UGC 1908), the Hβ line has also been redshifted into the observed spectral range. Toward the red (right) spectral regions, various stellar absorption lines are visible including the MgIb triplet (position indicated above the panel) and several Fe lines.
In the following two rows, we provide images based on information extracted from the PPak fibers reconstructed in two dimensions. The second row provides information based on the stellar continuum, while the third row is for the [Oiii]λ5007 Å emission line. Each map is 90′′ on a side, centered on the galaxy, and the small white cross inside a slightly larger black cross indicates the morphological center of the galaxy. From left to right, the panels provide:
-
1.
Reconstructed intensity maps of the stellar continuum (second row) and the total flux in the [Oiii]λ5007 Å emission line (third row). The procedure used to create these images, including the interpolation scheme used to fill interstitial regions is discussed in Sect. 6.11. The FWHM of the Gaussian kernel used to smooth the image (1.5 fiber diameter or ~
 ) is shown as a hatched circle in the lower-right corner of the panel. These reconstructed continuum maps reproduce, in detail, the morphologies of the galaxies as seen in the POSS II images provided in the first row. The [Oiii] intensity maps are much patchier, concentrated toward the spiral arms, and have holes in areas where no [Oiii] emission was detected.
 -
2.
Observed velocity fields with data points weighted by their errors and smoothed with a Gaussian kernel with FWHM of ~
 . The method used to generate these maps is the same as described in Appendix A of Paper IV. Isovelocity contours are plotted to highlight the structure in each velocity field; the contour levels are given in the table at the bottom right of each page. The thick black contour indicates the systemic velocity while the thin black and white contours show the receding and approaching sides of the disk, respectively.
 -
3.
Model velocity fields based on the fitted tanh-model for the rotation-curve shape as described in Sect. 7.2. Although the model provides a velocity for all fibers, only those fibers with measured velocities are included. These model velocities are smoothed in exactly the same way as the observational data, except that all data have the same weight. As discussed in Sect. 7.3.1, non-axisymmetric features in the model velocity fields are the result of irregular sampling due to missing fibers without observed data and the interpolation scheme. Consequently, deviations from axisymmetry occur mainly at the edges of the field-of-view for the stellar data and, for the same reason, near the galaxy centers for the [Oiii] velocity fields. The isovelocity contour levels are the same for the model and observed velocity fields.
-
4.
Residual velocity fields calculated simply as the observed minus the modeled velocity fields. The contour levels are listed in the table, where black contours indicate positive residuals and white contours negative residuals.
-
5.
Line-of-sight velocity dispersion maps, also interpolated and smoothed using a Gaussian kernel with a FWHM of ~8″, where the data points with errors on σLOS exceeding 8 km s-1 have been rejected and the remaining data is weighted by the errors. Contours are drawn in steps of 8 km s-1; the lowest contour (thick line) is at 16 km s-1, which is similar to the instrumental spectral dispersion.
-
6.
Signal-to-noise maps that use no interpolation to fill interstitial regions; any point lying within a fiber aperture is given the value of the S/N of the spectrum from that fiber. In the second row, the plotted values are the average S/N in the spectral continuum; for the third row, they are the ratio of the [Oiii] intensity to its error. No values are plotted for spectra that had measurements with S/N < 1.
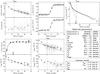
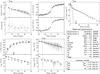
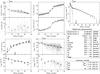
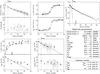
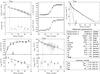
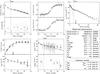
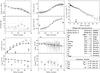
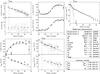
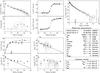
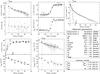
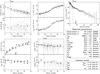
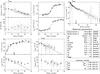
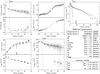
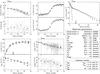
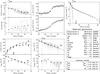
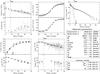
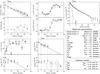
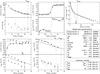
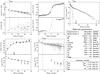
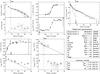
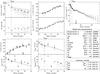
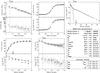
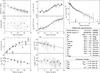
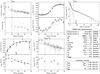
Appendix B.2: Radial profiles
The bottom half of each page presents various quantities measured for each galaxy as a function of in-plane radius. These radii are determined using the geometric projection parameters derived in Sect. 7.2.
Above the tables to the right, we provide the K-band surface-brightness profile discussed in Sect. 3. The dotted line indicates the result from the iterative fit of an exponential disk; the line is solid within the converged radial fitting range of 1–4hR, where 1hR is indicated by an arrow. The corresponding photometric scale lengths and central surface brightness are considered as representative for the disk. The curved solid line in the inner region represents the best-fitting bulge profile, a Gaussian smoothed Sérsic profile as described in Sect. 3. The dashed vertical line indicates the radius at which the bulge contributes 10% to the azimuthally-averaged surface brightness (Rbulge).
To the left, we provide four groups of two panels. Clockwise, starting from the upper left, these groups provide:
-
1.
Continuum and [Oiii] intensities: the greypoints show the intensities in individual spectra, while the blackpoints show the weighted-average data in radial bins. The verticaldashed line marks Rbulge. The scatter in the grey points at a certain radius indicates the azimuthal surface-brightness fluctuations at that radius. The very high [Oiii] intensities at the centers of some galaxies indicate the presence of an active galactic nucleus (see, e.g., UGC 1908, UGC 4036 and UGC 6918).
-
2.
Position–velocity diagrams of the stellar and [Oiii] gas recession velocities for data within ±45° of the kinematic major axis; the line-of-sight velocities have been corrected for the in-plane azimuth to match the line-of-sight velocities along the major axis. The solid and dashed curves indicate the hyperbolic-tangent function fitted to the shape of the rotation curve for the stars and [Oiii] gas, respectively; see Sect. 7.3.1. The black points indicate the velocities as derived from the tilted-ring fitting (Sect. 7.3.2). Both the parameterized rotation curve and the tilted-ring fits are based on data from both the approaching and receding sides of the galaxy. Thus, the derived rotation curves are symmetric around R = 0, even though the data may show kinematic asymmetries.
-
3.
Line-of-sight velocity dispersions (σLOS) of the stars and [Oiii] gas. Grey error bars correspond to individual measurements while black filled (stars) and open ([Oiii]) circles represent weighted-averages in radial bins (Sect. 7.3.2). The vertical dashed line indicates Rbulge. The black solid line represents the exponential fit to σLOS of the stars described in Sect. 8.1; this fit excluded σLOS measurements with errors larger than 8 km s-1 (also excluded from the Figure) and data within Rbulge.
-
4.
Projected rotation curves and velocity-dispersion profiles for both the stars (solid points) and [Oiii] gas (open circles) in the same panel. The solid lines indicate the best-fitting parameterized models for the stars; the best-fitting model rotation curve for the [Oiii] gas is shown as a dashed line. These curves are the same as those provided in the second and third panel groups.
Appendix B.3: Tables
In the lower right corner of each Atlas page, we provide two tables. The upper table lists the parameters of the derived orientation and kinematics of the galaxy, including the coordinates (α and δ; Sect. 7.2.1) of the morphological center, the systemic velocity and position angle of the receding side of the kinematic major axis (Vsys and φ0; Sect. 7.2.2), the Tully-Fisher-based inclination of the galaxy disk (iTF; Sect. 7.2.3), the asymptotic rotational velocity and the scale radius of the fitted parameterized rotation curve (stellar: Varot,star and rs,star; [Oiii] gas: Varot,OIII and rs,OIII); Sect. 7.3), and the fitted central line-of-sight velocity
dispersion and dispersion scale length of the stellar disk (σ0, ∗ and hσ∗; Sect. 8.1). The optical radial scale length (hR) and the radius (Rbulge) at which the bulge contributes 10% to the surface brightness is tabulated in the bottom. The second table provides the contour levels and intervals for the observed, modeled and residual velocity fields, as well as the velocity-dispersion maps.
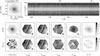
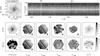
Appendix C: The PPak fiber position table
On-sky positions (in arcsec) of the 331 science fibers (1−331) and 36 sky fibers (501−536), relative to the central fiber #164.
Appendix D: The Atlas

© ESO, 2013
Current usage metrics show cumulative count of Article Views (full-text article views including HTML views, PDF and ePub downloads, according to the available data) and Abstracts Views on Vision4Press platform.
Data correspond to usage on the plateform after 2015. The current usage metrics is available 48-96 hours after online publication and is updated daily on week days.
Initial download of the metrics may take a while.