| Issue |
A&A
Volume 556, August 2013
|
|
|---|---|---|
| Article Number | A133 | |
| Number of page(s) | 10 | |
| Section | Planets and planetary systems | |
| DOI | https://doi.org/10.1051/0004-6361/201321871 | |
| Published online | 08 August 2013 | |
Online material
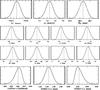 |
Fig. 1
Marginal parameter distributions for DE0823−49 obtained from 7.5 × 10⁶ MCMC iterations. In each panel, the dashed line indicates the median value of the respective parameter identified by the x-coordinate lable. Y-coordinate units are arbitrary and indicate relative occurrence. |
| Open with DEXTER | |
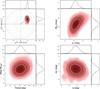 |
Fig. 2
Joint marginal distribution of several parameters for DE0823−49 obtained from
7.5 × 10⁶ MCMC iterations. In each panel, contour lines represent the
1, 2, and 3σ confidence intervals of the joint distribution.
Sub-panels show the marginal distributions. The top-left
panel represents the joint distribution of the parameters
|
| Open with DEXTER | |


Appendix A: Data covariance
Due to the reduction procedure, the individual frame measurements within one epoch are not independent but are instead subject to correlated noise of equal magnitude in RA and Dec. Therefore, the corresponding covariance matrix contains non-zero off-diagonal elements and has a block-diagonal form with the nominal uncertainties on the diagonal and the covariance amplitude on the off-diagonal elements for each epoch. The covariance between data taken at different epochs is always zero. Because consideration of the covariances is expensive in computation time, we neglect the off-diagonal terms of the covariance matrix to run the principal part of the MCMC. We quantified the effect of considering the full covariance matrix by running an MCMC with fewer (105) iterations. The results in both cases are statistically indistinguishable because the parameter standard deviations are equivalent and the differences in the median parameter values are less than σ/10. The only significant difference is a smaller resulting nuisance parameter in RA (sα) when considering the full covariance matrix (0.08 mas compared to 0.16 mas with a diagonal covariance matrix), indicating that this parameter sensibly accounts for additional signals in the form of correlated noise. We conclude that the off-diagonal terms of the covariance matrix can be neglected when employing the analysis methods presented here.
Appendix B: Comparison with Galaxy model
Figure B.1 illustrates how we use a model of the Galaxy to determine the parallax correction Δϖ.
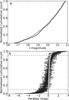 |
Fig. B.1
Using a galaxy model to determine the parallax correction. Cumulative distribution of magnitudes (panel a)) and parallaxes (panel b)) for the 283 reference stars of DE0823−49. The model and measured data are shown in grey and black, respectively. |
| Open with DEXTER | |
Appendix C: Primary mass estimation using bolometric luminosity
As a consistency check, we used the method of Sect. 3.5 restricted to the three 2MASS bands and compared the results to a method that relies on an estimation of the bolometric luminosity. We converted 2MASS magnitudes to the MKO system using updated colour transformations (Carpenter 2001)1 and bolometric corrections (Liu et al. 2010) to obtain the luminosity, and we assumed an uncertainty of one spectral type subclass. The corresponding mass at a given age was found by interpolating the BT-Settl models. Differences between J, H, K are negligible, and we used their average. The resulting masses lie a few percent higher than the estimation with the previous method, but both methods yield compatible results within the adopted 10% uncertainty. At 1 Gyr the alternative mass estimate is 0.079 ± 0.001, where the error reflects only the uncertainty in spectral type. In the age range of 0.6–10 Gyr, the alternative mass range is 0.072 − 0.081 M⊙.
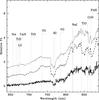 |
Fig. C.1
Comparison of the optical spectra of DE0823−49 from Phan-Bao et al. (2008) (solid), the “old” L1 dwarf DENIS-P J1441-0945 (dashed), and the “young” L1 dwarf G 196-3 B (dotted), both from Martín et al. (1999b). The relevant spectral features are labelled. |
| Open with DEXTER | |
Appendix D: Compilation of very low-mass binary systems
The sample of binaries shown in Fig. 5 was constructed on the basis of the compilation at vlmbinaries.org. Because its last update was in July 2009, we searched the literature for new systems and revised parameters. We added 24 systems from Choi et al. (2013), Burgasser et al. (2011), Allers et al. (2010), Gelino & Burgasser (2010), Liu et al. (2010, 2011), Kraus & Hillenbrand (2012), Gelino et al. (2011), Chauvin et al. (2012), Geyer et al. (1988), Phan-Bao et al. (2006), Allers et al. (2009), and Burgasser et al. (2009), and we updated system parameters, when applicable, using the compilations of Liu et al. (2010), Dupuy & Liu (2011), and Kraus & Hillenbrand (2012).
© ESO, 2013
Current usage metrics show cumulative count of Article Views (full-text article views including HTML views, PDF and ePub downloads, according to the available data) and Abstracts Views on Vision4Press platform.
Data correspond to usage on the plateform after 2015. The current usage metrics is available 48-96 hours after online publication and is updated daily on week days.
Initial download of the metrics may take a while.