| Issue |
A&A
Volume 556, August 2013
|
|
|---|---|---|
| Article Number | A136 | |
| Number of page(s) | 27 | |
| Section | Extragalactic astronomy | |
| DOI | https://doi.org/10.1051/0004-6361/201219998 | |
| Published online | 08 August 2013 | |
Online material
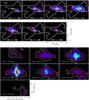 |
Fig. 20
Brγ channel maps and position velocity diagrams. Prior to extraction all slices with constant wavelength of the datacube were convolved with a Gaussian seeing disk with a FWHM of 0.10 arcsec. Top: channel maps. 21 cm radio contours in gray (.5, 1, 2, and 4 mJy beam-1 with a beam size about four times smaller than our angular sampling) and the white contours are 10%, 25%, 40%, and 55% of the Brγ peak intensity. Velocity ranges are given in km s-1. North is up and east to the left. Bottom: Position velocity diagrams extracted from pseudoslits oriented from east to west. The Y offset is the angular offset of the pseudoslit with respect to the nucleus. Along the pseudoslit, position 0 indicates the position of the continuum peak. Contours represent 10%, 25%, 40%, and 55% of the Brγ peak intensity. |
| Open with DEXTER | |
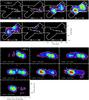 |
Fig. 21
Same as Fig. 20, but for 1-0S(1). |
| Open with DEXTER | |
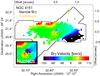 |
Fig. 22
Brγ velocity field derived from single-Gaussian fits to the line profile extracted from every spaxel with continuum contours (20% and 50% of the peak value) in yellow. The inset shows the Brγ velocity field on the nucleus scaled in velocity from −75 km s-1 (blue) to 75 km s-1 (red). |
| Open with DEXTER | |
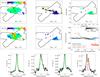 |
Fig. 23
Same as Fig. 16, but for Brγ. All slices with constant wavelength of the datacube were convolved with a Gaussian seeing disk with a FWHM of 0.2 arcsec. |
| Open with DEXTER | |
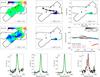 |
Fig. 24
Same as Fig. 16, but for 1-0S(1). All slices with constant wavelength of the datacube were convolved with a Gaussian seeing disk with a FWHM of 0.15 arcsec. |
| Open with DEXTER | |
© ESO, 2013
Current usage metrics show cumulative count of Article Views (full-text article views including HTML views, PDF and ePub downloads, according to the available data) and Abstracts Views on Vision4Press platform.
Data correspond to usage on the plateform after 2015. The current usage metrics is available 48-96 hours after online publication and is updated daily on week days.
Initial download of the metrics may take a while.