| Issue |
A&A
Volume 555, July 2013
|
|
|---|---|---|
| Article Number | A24 | |
| Number of page(s) | 18 | |
| Section | Stellar atmospheres | |
| DOI | https://doi.org/10.1051/0004-6361/201321063 | |
| Published online | 21 June 2013 | |
Online material
Appendix A: Summary of AMBER observations
Our AMBER observations of Antares are summarized in Tables A.1 and A.2.
Log of AMBER observations of Antares and the calibrator α Cen A in April 2009 with the E0-G0-H0 (16-32-48 m) baseline configuration.
Log of AMBER observations of Antares and the calibrators α Cen A and α Cen B in April 2010.
Appendix B: Image reconstruction of simulated data
We generated interferometric data (visibility amplitudes and closure phases) from simulated stellar images by sampling at the same uν points as our AMBER observations. The image reconstruction from these simulated interferometric data allows us to find the appropriate parameters (such as the initial model, prior, and regularization scheme) that can restore the original images correctly.
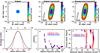 |
Fig. B.1
Image reconstruction from the simulated data for a limb-darkened disk with the parameters derived from the 2009 data. a) Original image. b) Original image after convolving with the Gaussian beam with 9.8 × 63.2 mas. c) Reconstructed image after convolving with the beam. d) The intensity profiles of the original image are plotted by the red dotted line (along the minor axis) and the black dotted line (along the major axis). The intensity profiles of the reconstructed images are plotted by the red solid line (along the minor axis) and black solid line (along the major axis). The abscissa for the intensity profiles along the major axis is shown at the top of the panel. e) Comparison between the visibilities generated from the original image (filled dots) and those from the reconstructed image (triangles). f) Comparison between the CPs generated from the original image (filled dots) and those from the reconstructed image (triangles). |
| Open with DEXTER | |
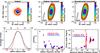 |
Fig. B.2
Image reconstruction from the simulated data for a uniform disk with surface inhomogeneities and an asymmetric extended component, shown in the same manner as Fig. B.1. |
| Open with DEXTER | |
For our data on Antares, we tested the image reconstruction for a limb-darkened disk with the angular diameter and the limb-darkening parameter derived for the 2009 data and a uniform disk with surface inhomogeneities and an extended component. The simulated interferometric data were generated using a program developed by one of the authors (Hofmann) as follows. For each telescope triplet, we simulated two-telescope interferograms corresponding to the three baseline vectors for a given object (e.g., limb-darkened stellar disk or spotted star). The simulated interferograms were degraded by the atmospheric piston, photon noise, sky background, and detector noise. From ~1000 simulated two-telescope interferograms on each baseline, the average power spectrum and bispectrum were calculated. The subtraction of the noise bias terms and calibration with an unresolved calibrator star yielded the calibrated visibilities and closure phases for the simulated object. The amount of noise in the simulated interferograms was chosen to obtain approximately the same errors as in the AMBER measurements of Antares.
The reconstructed images were convolved with the clean beam, which was determined in the following manner. The spa-tial resolution in the direction of the uν points with the longest baseline length (Bmax) is given by λ/Bmax = 9.8 mas. However, the sparse uν coverage shown in Fig. 1 leads to a strongly elongated beam. We fitted the central peak of the dirty beam with a 2D Gaussian and derived the ratio between the major and minor axes and the position angle. The beam defined in this manner is narrower than that given by λ/Bmax, because of the lack of data at very short baselines. Therefore, we scaled the major and minor axes of this Gaussian beam so that the beam size along the minor axis matches the resolution given by λ/Bmax. The final clean beam for the uν coverage obtained in 2009 is a 2D Gaussian with 9.8 × 63.2 mas (FWHM) with the major axis at a position angle of − 12°.
The results of the image reconstruction of two sets of simulated data are shown in Figs. B.1 and B.2. The reconstructed images agree reasonably well with the original image after convolving with the beam. These tests show that the uniform-disk initial model with angular diameters of 36–37 mas and the same prior as used in Paper II are appropriate for the image reconstruction from our AMBER data of Antares. The prior is given by
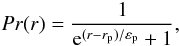 where r is the radial coordinate in mas, and rp and εp define the size and the smoothness of the edge, respectively (εp → 0 corresponds to a uniform disk). The appropriate values for rp and εp were found to be 12 mas and 2.4 mas, respectively. We adopted the maximum entropy regularization as in Paper II.
Appendix C: Fit to the interferometric data
Figures C.1 and C.2 show the fit to the measured interferometric observables for the image reconstruction in the CO line shown in Figs. 5 and 7, respectively.
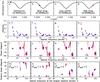 |
Fig. C.1
Comparison between the interferometric observables measured in 2009 and those from the reconstructed images within the CO line profile shown in Fig. 5. The first, second, third, and fourth columns show the comparison for the continuum, blue wing, line center, and red wing, respectively. The filled circles in the top row (a)–d)) show the positions within the CO line profile. In the remaining panels, the observed data and those from the image reconstruction are plotted by the dots and triangles, respectively. The reduced χ2 values including the visibilities, phases, and closure phases, are given in the panels in the bottom row. |
| Open with DEXTER | |
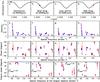 |
Fig. C.2
Comparison between the interferometric observables measured in 2010 and those from the reconstructed images within the CO line profile shown in Fig. 7. The panels are shown in the same manner as in Fig. C.1. |
| Open with DEXTER | |
© ESO, 2013
Current usage metrics show cumulative count of Article Views (full-text article views including HTML views, PDF and ePub downloads, according to the available data) and Abstracts Views on Vision4Press platform.
Data correspond to usage on the plateform after 2015. The current usage metrics is available 48-96 hours after online publication and is updated daily on week days.
Initial download of the metrics may take a while.