Fig. B.1
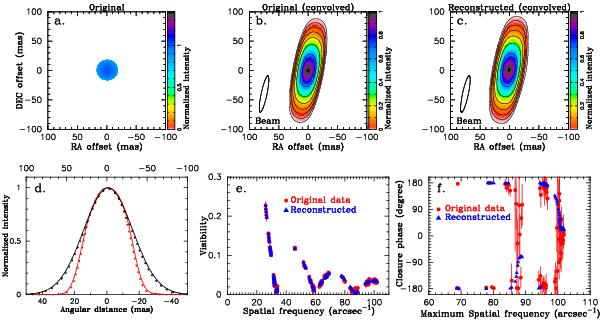
Image reconstruction from the simulated data for a limb-darkened disk with the parameters derived from the 2009 data. a) Original image. b) Original image after convolving with the Gaussian beam with 9.8 × 63.2 mas. c) Reconstructed image after convolving with the beam. d) The intensity profiles of the original image are plotted by the red dotted line (along the minor axis) and the black dotted line (along the major axis). The intensity profiles of the reconstructed images are plotted by the red solid line (along the minor axis) and black solid line (along the major axis). The abscissa for the intensity profiles along the major axis is shown at the top of the panel. e) Comparison between the visibilities generated from the original image (filled dots) and those from the reconstructed image (triangles). f) Comparison between the CPs generated from the original image (filled dots) and those from the reconstructed image (triangles).
Current usage metrics show cumulative count of Article Views (full-text article views including HTML views, PDF and ePub downloads, according to the available data) and Abstracts Views on Vision4Press platform.
Data correspond to usage on the plateform after 2015. The current usage metrics is available 48-96 hours after online publication and is updated daily on week days.
Initial download of the metrics may take a while.