| Issue |
A&A
Volume 555, July 2013
|
|
|---|---|---|
| Article Number | A11 | |
| Number of page(s) | 30 | |
| Section | Planets and planetary systems | |
| DOI | https://doi.org/10.1051/0004-6361/201321050 | |
| Published online | 19 June 2013 | |
Online material
Appendix A: DUNES Virtual Observatory tool
The achievement of the DUNES objectives requires a detailed knowledge of the properties and environment of the targets to be studied. There exists a huge amount of astrophysical data and information about the DUNES objects, distributed in a number of archives and services. Gathering information in a wide variety of types and formats from a large number of heterogeneous astronomical data services is a tedious, very time consuming task even for a modest data set. With this aim we have developed a Virtual Observatory11 (VO) application for accessing, visualizing and downloading the information on DUNES targets available in astronomical archives and services. Given a list of objects, identified by their names or coordinates, a real-time exploration of Vizier12 using VO protocols is performed to gather photometric data as well as physical parameters. This information can be complemented with searches of images, spectra and catalogues in all the Virtual Observatory services. Moreover, ad hoc access to other non VO-compliant services of interest (like NStED or Spitzer/FEPS) is also provided. The obtained information can be downloaded in ASCII, VOTable (standard format for tabular data in the Virtual Observatory) or HTML format. For heavy queries, the tool implements a batch mode informing the user via e-mail when the search is complete. The message includes a link to the data through which the information can be downloaded.
In addition, one of the goals of the DUNES consortium is to provide the astronomical community with a legacy VO-compliant archive, as also requested by rules of the Herschel OTKPs. The DUNES Archive System13 is designed to ensure that other research groups gain easy access to both Herschel reduced data and ancillary data (photometry and physical parameters gathered from VO services), as well as to the DUNES VO discovery tool, the DUNES project web page as well as to a section including news on the archive. A HelpDesk to pose questions to archive staff is also available.
Appendix B: Stellar fluxes and parameters
Table 3, with several subtables, presents the magnitudes and fluxes of the DUNES stars which have been used to trace their spectral energy distributions. Optical, near-IR, WISE, AKARI, IRAS and Spitzer data are included.
Table 4 gives some relevant parameters of the stars. Teff,
log g and [Fe/H] are average values of photometric and spectroscopic
estimates mainly from Gray et al. (2003); Santos et al. (2004); Takeda et al. (2005); Valenti &
Fischer (2005); Gray et al. (2006);
Fuhrmann (2008); Sousa et al. (2008); Holmberg et al.
(2009). Rotational velocity values are taken from Martínez-Arnáiz et al. (2010). Bolometric luminosities and stellar
radii have been estimated from the absolute magnitudes and bolometric corrections using
the measurements by Flower (1996). The activity
index  has been
taken from Martínez-Arnáiz et al. (2010) while we
have derived the X-ray luminosities based on ROSAT, XMM and Chandra
data. The table also provides ages based on the
index and
on the X-ray luminosities as estimated by Maldonado et
al. (2010). There is a wide range of age estimates in the literature using
different tracers for the DUNES stars. Stellar ages of our targets are difficult to
estimate on the basis of isochrones given that the stars are located on the
main-sequence (see Fig. 2) and that they are
sensitive to Teff and metallicity (Holmberg et al. 2009). Thus, we have opted to give in Table 4 the age
estimates based on our own coherent data set and procedure.
has been
taken from Martínez-Arnáiz et al. (2010) while we
have derived the X-ray luminosities based on ROSAT, XMM and Chandra
data. The table also provides ages based on the
index and
on the X-ray luminosities as estimated by Maldonado et
al. (2010). There is a wide range of age estimates in the literature using
different tracers for the DUNES stars. Stellar ages of our targets are difficult to
estimate on the basis of isochrones given that the stars are located on the
main-sequence (see Fig. 2) and that they are
sensitive to Teff and metallicity (Holmberg et al. 2009). Thus, we have opted to give in Table 4 the age
estimates based on our own coherent data set and procedure.
Appendix C: Prediction of photospheric fluxes at the PACS and SPIRE wavelengths
Appendix C.1: Models
The behaviour of three families of model atmospheres was studied in order to choose the best option for the photospheric work of the project: PHOENIX/GAIA (Brott & Hauschildt, 2005), ATLAS9 (Castelli & Kurucz 2003) and MARCS (Gustafsson et al. 2008). It was found that for Teff ≥ 5000 K the three sets of models are virtually identical. In the interval 4000–5000 K the models start to show some differences which are more pronounced towards lower temperatures and shorter wavelengths, the models being identical for λ > 4 μm. For lower temperatures – only seven DUNES stars have Teff below 4000 K – the three sets of models present larger discrepancies, with ATLAS9 being more different when compared with the other two families.
The PHOENIX/GAIA set of models was finally chosen because of its finer grid in effective temperatures, sampling of the individual model spectra and overall behaviour. The models were computed in LTE, the opacity treated with the opacity sampling formalism, and more than 300 million lines were included. The synthetic spectra have a variable amount of wavelength points, between 50 000 and 55 000, cover the interval 0.001–50 μm, vturb was set to 2 km s-1, the mixing length parameter is 1.5 and the geometry is plane parallel, or spherical in those cases where that one is not correct.
Due to their extremely large resolution, the synthetic spectra were smoothed with a Gaussian filter with FWHM = 0.005 after taking the decimal logarithm of the wavelengths in angstroms. Following that, the wavelength scale was put back in physical units.
A grid of 1980 spectra (55 temperatures ×6 gravities ×6 metallicities) was available. The ranges covered are 3000 K < Teff < 9800 K, 3.0 < log g < 5.5 (step 0.5 dex) and −2.0 < [Fe/H] < + 0.5 (step 0.5 dex).
In general, the synthetic spectrum for a given star is not contained in the grid, therefore, an interpolation in three dimensions had to be done. Since the PHOENIX/GAIA models only run up to λ = 40 μm, an extension up to 4 mm using the Rayleigh-Jeans approximation was attached to the original model.
Appendix C.2: Normalization of the models to the observed SED
The normalization of the model photosphere to the observed SED was done using the
procedure outlined by Bertone et al. (2004).
The monochromatic fluxes of the SED, s(λ) (in units
of Jy), were compared with those of the synthetic model,
m(λ) (in the same units), at the corresponding
wavelengths, deriving a residual function:
 (C.1)The offset
constant is such that
(C.1)The offset
constant is such that 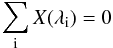 (C.2)so
k = ⟨ lnm(λ) − lns(λ) ⟩.
(C.2)so
k = ⟨ lnm(λ) − lns(λ) ⟩.
Five subsets of the full SED were chosen to carry out five normalizations, namely, VI+nIR, BVI+nIR, VI+nIR+WISE, nIR+WISE and VI+nIR+WISE. The near infrared photometry (nIR) consists of 2MASS JHKs (only magnitudes with quality flags “A” or “B” were considered), plus additional JHKL points, when available. WISE band W1 (3.35 μm) was used in most of the cases despite of being nominally saturated14 because PSF photometry was carried out on the images and therefore the values provided in the all-sky release turned out to be usable (Stapelfeldt, priv. comm.), only the brightest targets showed unacceptable values of W1 magnitudes; WISE W2 (4.60 μm) photometry was never used; its flux level, when looking at the SED as a whole, always deviates from the overall behaviour; WISE W3 (11.56 μm) was always used unless it was brighter than the saturation magnitude; WISE W4 (22.09 μm) was also always used unless the shape of the SED indicated that an excess could start around that wavelength.
Since each normalization was done with a different number of points (e.g. degrees of freedom), a reduced χ2 was computed for each one in order to make a comparison of all of them. The selected normalization was that with the least reduced χ2 and was used to predict the fluxes at the PACS and SPIRE wavelengths. The uncertainties in the individual photospheric fluxes were estimated by computing the total σ of the normalization, in logarithmic units; in this calculation the observed flux at each wavelength involved in the normalization process was compared with its corresponding predicted flux. The result is that the normalized model log S(λ) can be allowed to move up and down a quantity ± σ. That value of σ was then translated into individual – linear – uncertainties of the fluxes at the relevant Herschel wavelengths.
Appendix D: Spurious sources
There is a number of objects whose fluxes seemingly denote an excess, which can in a first instance be attributed to a circumstellar disc, but whose morphologies and surrounding fields suggest they are not true debris discs associated with the stars. Very likely, these stars are affected by coincidental alignment or contamination from a structured background. In the following, we briefly describe these cases and show their PACS images and contour plots in Figs. D.1 and D.2. Table D.1 lists these sources
together with their PACS and predicted photospheric fluxes. The significance of the “apparent” excesses is also given, as well as the Spitzer MIPS 70 μm fluxes.
HIP 29568. The 160 μm flux has a significance of χ160 = 3.00 (Table D.1), being a cold disc candidate. However, the image shows a lot of background structure (Fig. D.1) which makes the flux estimate doubtful.
HIP 38784. This is a faint star which apparently shows a small excess at 160 μm. However, reduced images from HIPE versions 7.2 (Fig. D.1) and 4.2 are not quite consistent, as neither are the individual scans likely due to the faintness of the source.
HIP 40843. This star was identified by Spitzer as an
excess source. However, the positional offset between the star and the peak of the PACS
image is large. Both the 100 and 160 μm images are extended but
practically in perpendicular directions (Fig. D.1). The fluxes of the table correspond to the whole extended emission.
However, given the position of the star and the different orientations at 100 and 160
μm, we consider it a case of coincidental alignment of a background
galaxy. In fact, there is a very faint, secondary 100 μm peak embedded
in the extended emission. This peak is at the position α (2000.0) =
8:20:03.78, δ (2000.0) = 27:13:4.6, i.e., and offset of
1 4 wrt the
optical positions on the star, and of 81 wrt the main 100
μm peak. A 2D Gaussian fit supports the presence of two peaks.
4 wrt the
optical positions on the star, and of 81 wrt the main 100
μm peak. A 2D Gaussian fit supports the presence of two peaks.
HIP 71908. The star lies on top of an emission strip at both 100 and 160 μm (Fig. D.2), which prevents us from estimating an enough accurate flux in the red band. This star is located at the galactic plane. The marginal 100 μm significance, χ100 = 3.13, is likely not real.
HIP 85295. There is an offset between the 100 μm peak, which coincides with the optical position, and the 160 μm peak emission (Fig. D.2). At this wavelength, the object seems to be formed by two different ones separated by ~6″. The western one is close to the 100 μm peak. Thus, the apparent excess emission at 160 μm is likely due to contamination by a background galaxy.
HIP 105312. The 100 μm peak agrees well with the optical position, but the 160 μm emission, which appears resolved, is displaced a bit towards the west. (Fig. D.2).
HIP 113576. This is a case of a very clear offset between the 100 and the 160 μm emission, which likely falsifies the presence of an excess (Fig. D.2).
DUNES stars whose apparent excesses are very likely due to contamination by background galactic extended structures or extragalactic objects.
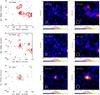 |
Fig. D.1
Contour plots (left) and PACS 100 μm (middle) and 160 μm (right) images of stars for which contamination impacts the apparent excesses of the stars. The identification of the stars are given in the upper-left corner of the contour plots. Position (0,0) refers to the 100 μm peak. The optical position of the stars with respect to the 100 μm peak is indicated by a “star” symbol. North is up and east to the left. Black contours correspond to 100 μm and red contours to 160 μm. HIP 29568: contours are 40%, 50%, 60%, 70%, 80%, 90% of the peak at both bands. HIP 38784: contours are 50%, 60%, 70%, 80%, 90% of the peak at both bands. HIP 40843: contours 20%, 40%, 60%, 80%, 90% of the peak at both bands. |
| Open with DEXTER | |
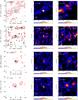 |
Fig. D.2
Same as Fig. D.1. In this case contours are 20%, 40%, 60%, 80%, 90% of the peak at both 100 and 160 μm bands for all the images. |
| Open with DEXTER | |
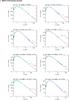 |
Fig. E.1
SEDs of DUNES stars with excesses. |
| Open with DEXTER | |
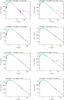 |
Fig. E.1
continued. |
| Open with DEXTER | |
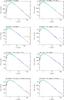 |
Fig. E.1
continued. |
| Open with DEXTER | |
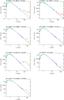 |
Fig. E.1
continued. |
| Open with DEXTER | |
© ESO, 2013
Current usage metrics show cumulative count of Article Views (full-text article views including HTML views, PDF and ePub downloads, according to the available data) and Abstracts Views on Vision4Press platform.
Data correspond to usage on the plateform after 2015. The current usage metrics is available 48-96 hours after online publication and is updated daily on week days.
Initial download of the metrics may take a while.