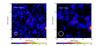
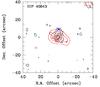
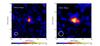
Fig. D.1
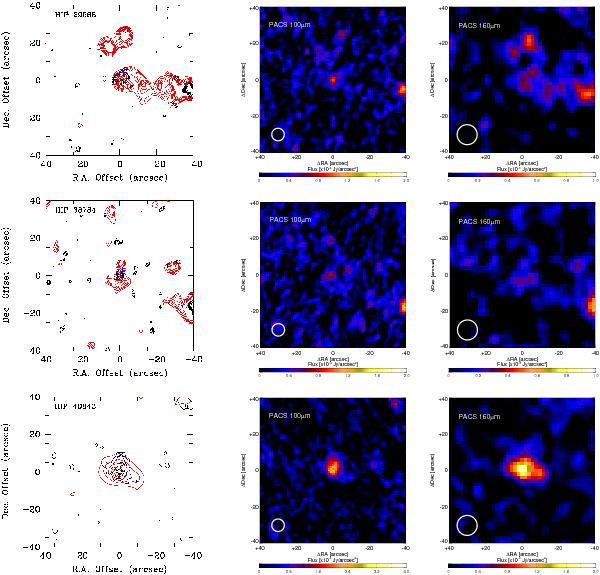
Contour plots (left) and PACS 100 μm (middle) and 160 μm (right) images of stars for which contamination impacts the apparent excesses of the stars. The identification of the stars are given in the upper-left corner of the contour plots. Position (0,0) refers to the 100 μm peak. The optical position of the stars with respect to the 100 μm peak is indicated by a “star” symbol. North is up and east to the left. Black contours correspond to 100 μm and red contours to 160 μm. HIP 29568: contours are 40%, 50%, 60%, 70%, 80%, 90% of the peak at both bands. HIP 38784: contours are 50%, 60%, 70%, 80%, 90% of the peak at both bands. HIP 40843: contours 20%, 40%, 60%, 80%, 90% of the peak at both bands.
Current usage metrics show cumulative count of Article Views (full-text article views including HTML views, PDF and ePub downloads, according to the available data) and Abstracts Views on Vision4Press platform.
Data correspond to usage on the plateform after 2015. The current usage metrics is available 48-96 hours after online publication and is updated daily on week days.
Initial download of the metrics may take a while.