| Issue |
A&A
Volume 555, July 2013
|
|
|---|---|---|
| Article Number | A1 | |
| Number of page(s) | 42 | |
| Section | Stellar atmospheres | |
| DOI | https://doi.org/10.1051/0004-6361/201220798 | |
| Published online | 18 June 2013 | |
Online material
Appendix A: Best fits
In this appendix we give more details of the parameter determination of each individual star and compare our best-fit models to the optical and UV spectra. Absolute fluxes in UV spectra are provided after correcting for reddening (see Sect. 3.2 and Table 1) and are expressed in erg Å-1 s-1 cm-2
Appendix A.1: MPG 355 – ON2 III (f∗)
MPG 355 was already studied extensively in the UV and optical in Bouret et al. (2003), to which we refer for a thorough discussion of the STIS spectrum. More recently, Massey et al. (2009) obtained a new optical spectrum with a higher S/N of MPG 355; they detected a very weak He λ4471 (their Fig. 7) that is not visible in our own spectrum. This biased Bouret et al. (2003) toward a higher Teff.
On the other hand, He iλ5876 is not detected in our high S/N UVES spectrum while this line would be expected at Teff = 50 000 K in a test model we computed. Furthermore, several lines of CNO elements argue in favor of a higher effective temperature Teff = 52 500 K. This is the case of C ivλ1169 and C iiiλ1176, where the intensity of individual lines (the C iii line is not detected in the STIS spectrum) is best fitted for such a Teff. Other lines include N vλλ4604−4620 and N ivλ6381, where both the intensity of individual lines and line ratio of these successives ionization stages argue for the adopted Teff. Finally, we found that emission from incoherent electron scattering in the wings of He iiλ4686 is predicted somewhat too strong and that a higher effective temperature (55 000 K) would solve this problem. Overall, we are quite confident that the effective temperature of MPG 355 as quoted in Bouret et al. (2003) and in the present paper is correct. The recent results by Rivero González et al. (2012) also strengthen this conclusion and the other quantities derived here.
Compared with our previous study, we only changed the nitrogen surface abundance to better fit the N ivλ6381, still maintaining a very good fit to other lines from nitrogen ions.
 |
Fig. A.1
Left: best-fit model for MPG 355 (red line) compared with the COS spectrum (black line). Right: best-fit model for MPG 355 (red line) compared with the AAT and UVES spectra (black line). |
| Open with DEXTER | |
Appendix A.2: AzV 177 – O4 V
Detailed modeling of the optical spectrum of AzV 177 was presented by Massey et al. (2005) and Rivero González et al. (2012). Significant differences are found from these studies that concern photospheric quantities such as the surface gravity or the helium abundance, and the wind parameters. The 0.2 dex difference in log gc is very surprising since we used the same optical spectrum (kindly provide by Massey) and derived a similar Teff. Our modeling of this star relies on the FUV COS spectrum, which offers a better grasp on the wind properties. We also have several CNO lines at our disposal to constrain the surface abundances. The line ratio C ivλ1169 to C iiiλ1176 argues for a Teff slightly lower than in Massey et al. (2005) and Rivero González et al. (2012), although both estimates would agree within error bars. The mass-loss rates also match within a factor of two, which is a very good agreement given the clumping filling factor we adopted. The wind velocity exponent is slightly higher in our case (β = 1.1 rather than 0.8), a result mostly driven by the fit to the C iv resonance doublet. We note that this higher β additionally precludes using He/H = 0.15 from Massey et al. (2005) and Rivero González et al. (2012), because He ii 4686 would show strong emission wings (already too strong here), which are not observed.
 |
Fig. A.2
Left: best-fit model for AzV 177 (red line) compared with the COS spectrum (black line). Right: best-fit model for AzV 177 (red line) compared with the CTIO spectrum (black line). |
| Open with DEXTER | |
Appendix A.3: AzV 388 – O4 V
AzV 388 was included in the sample of SMC stars investigated in Mokiem et al. (2006). We used the same optical spectrum, provided by P. Crowther. The fit to this spectrum is excellent throughout the whole spectral range, including UV. The derived parameters agree very well with those listed in Mokiem et al. (2006), well within the error bars. The only major discrepancy is the mass-loss rate, which we found to be a factor 3.3 times lower than their value which is based mostly on Hα. Still, the derived clumping filling factor f = 0.11 implies that our mass-loss rate would be scaled up by the exact same factor, if the wind were assumed to be homogeneous. This last assumption is incompatible with the O vλ1371 line profile, however.
 |
Fig. A.3
Best-fit model for AzV 388 (in red) compared with observed spectra (in black): the COS spectrum (upper left) and the UVES spectrum (upper right). A comparison with the UVES spectrum near the Balmer series is shown in the bottom panel. |
| Open with DEXTER | |
Appendix A.4: MPG 324 – O4 V ((f))
MPG 324 was studied in the UV and optical (AAT spectrum) in Bouret et al. (2003) and Heap et al. (2006) and was more recently included in two other studies by Mokiem et al. (2006) and Massey et al. (2009), both of them using the code fastwind for the modeling of the optical spectrum. Using this time the same optical spectrum (FLAMES) as in Mokiem et al. (2006), supplemented with our own UVES spectrum, the fundamental and wind parameters we derived differ only moderately from our initial study. Teff was increased by 600 K (a change driven by the He i 5876 line observed with very good S/N with UVES and no apparent nebular contamination) and agrees reasonably with other estimates for this star. The only significant difference with published results is the projected rotation velocity, which we find to be two times lower (vsin i = 70 km s-1 vs. 150 km s-1) than quoted Massey et al. (2009). Such a high value seems inconsistent with the UV spectrum, however, especially with the C iiiλ1176 multiplet. We finally note that from small velocity shifts observed in some lines, Evans et al. (2006) concluded that MPG 324 was probably a single-lined binary.
 |
Fig. A.4
Left: best-fit model for MPG 324 (red line) compared with the STIS spectrum (black line). Right: best-fit model for MPG 324 (red line) compared with the FLAMES and UVES spectra (black line). |
| Open with DEXTER | |
Appendix A.5: MPG 368 – O5 V ((f+))
MPG 368 was studied in the UV and optical (AAT spectrum) in Bouret et al. (2003) and Heap et al. (2006). Based on their own optical spectrum, Massey et al. (2009) confirmed the interpretation of Heap et al. (2006) that this star is a binary. A new optical spectrum obtained with UVES shows the He i lines as composites of two components (see Fig. A.5). Higher ionization lines seem to be unaffected, either in UV or optical, suggesting that the other component of this system is a late-O or B-type star. The fit to the observations with our model proves to be very reasonable, confirming that the companion of MPG 368 contributes only marginally to the wind line spectrum.
 |
Fig. A.5
Left: best-fit model for MPG 368 (red line) compared with the STIS spectrum (black line). Right: best-fit model for MPG 368 (red line) compared with the UVES spectrum (black line). |
| Open with DEXTER | |
Appendix A.6: MPG 113 – OC6 Vz
MPG 113 was extensively studied in Bouret et al. (2003), Heap et al. (2006), and Mokiem et al. (2006). Our best-fit model has the same parameters as quoted in our first study but for the mass-loss rate, which we slighlty increased to 3 × 10⁻⁹M⊙ yr-1 as a result of an improved log LX/Lbol ratio used in the new model (too high in the former study). Our Teff is still 3000 K lower than found in Mokiem et al. (2006), and although we used the same FLAMES spectrum as they did, we did not need to increase the helium abundance to fit the helium lines. This difference might come from a bias toward lower temperatures to reproduce the observed ratio of lines C ivλ1169/C iiiλ1176 in our case. For the adopted carbon abundance (based on these UV lines), the optical lines of C iiiλλ4647-50-52 were predicted slightly too strong, while C iiiλ5696 was slightly too weak. Both are nevertheless predicted in emission, as observed. We note that the N iiiλλ4634-4640 lines are neither observed nor predicted in our model. The resulting nitrogen-to-carbon ratio is above solar (see Table 3), like other stars of the O6 class, and as discussed in Sect. 5.2, the reason for the OC6 classification of MPG 113 is more complex than a simple abundance criterion.
 |
Fig. A.6
Best-fit model for MPG 113 (in red) compared with observed spectra (in black): the STIS spectrum (upper left) and the FLAMES+ UVES spectra (upper right). The bottom plot shows a comparison with the UVES spectrum for spectral regions around O iiiλ5592 (left), C iiiλ5696 (middle), and He iλ5876 (right). |
| Open with DEXTER | |
Appendix A.7: AzV 243 – O6 V
Of the O6 V stars of our sample, AzV 243 has the largest luminosity, consistent with its photometry. The luminosity we derive agrees well with the one quoted in Mokiem et al. (2006), but we found this star to be significantly cooler (by 2500 K) than in this study. With its higher luminosity, AzV 243 does not fall into the weak-wind regime, which is also confirmed by its COS spectrum, showing clear PCygni profiles at N v and C iv resonance doublet. The wind acceleration parameter β = 1 is intermediate between the value β = 0.7 given in Haser et al. (1998) and the value β = 1.37 in Mokiem et al. (2006). The latter is prone to higher uncertainty, however, because it was derived from the Hα line mostly, which poorly responds to wind parameters for Ṁ ≤ 1. × 10-7M⊙ yr-1 as is the case here.
 |
Fig. A.7
Left: best-fit model for AzV 243 (red line) compared with the COS spectrum (black line). Right: best-fit model for AzV 243 (red line) compared with the FLAMES spectrum (black line). |
| Open with DEXTER | |
Appendix A.8: AzV 446 – O6.5 V
AzV 446 was studied in Massey et al. (2005). Based on the line widths of He iλ4471 and He iiλ4542, these authors noted that this star could be a binary although the absolute magnitude of AzV 446 was consistent with a single star of luminosity class V. The very good agreeement of their model with the observed optical spectrum also supported the single-star interpretation. Our modeling of the flux-calibrated UV spectrum of AzV 446 additionally confirms this (the SED of our model also matches the photometry up to NIR). The fundamental parameters of our best model marginally differ from those in Massey et al. (2005) but for the wind parameters. From the UV only, though, we were unable to constrain the surface gravity and helium abundance to a good accuracy and simply adopted standard values for a young main-sequence star. We note that Massey et al. (2005) measured y = 0.15, surprisingly high for such a star. From the very weak C iv resonance profile, Ṁ = 1 × 10⁻⁷M⊙ yr-1 is ruled out. However, this profile, although weak, is clearly seen, as is the N vλλ1248-1250 profile, showing a discrete absorption component near the blue edge of the line. We also note that the C ivλλ1548-1550 resonance line presents a blueward extension that is clearly sensitive to f. We find that these two wind profiles are best reproduced when Ṁ = 4 × 10⁻⁹M⊙ yr-1, f = 0.1, and v∞ = 1400 km s-1.
 |
Fig. A.8
Best-fit model for AzV 446 (red line) compared with the COS spectrum (black line). |
| Open with DEXTER | |
Appendix A.9: MPG 356 – O6.5 V
This star was modeled in Heap et al. (2006), although in the UV only. Using the UVES spectrum we obtained for this star, we derived a higher temperature and surface gravity than Heap et al. (2006), although still within their error bars. Our luminosity is also lower (0.4 dex) but consistent with the complete photometric dataset, from UV to NIR. From the photospheric lines of carbon and nitrogen in the UV spectrum, we derived surface abundances significantly different from those in Heap et al. (2006). The carbon abundance is higher than measured in H II region of the SMC or even than a solar carbon abundance scaled down by a factor 0.2 corresponding to the global SMC metallicity. This abundance is consistent with the UV lines and with the C iiiλ5696 line in the UVES spectrum. Heap et al. (2006) found a moderate (if any) nitrogen enhancement from N iiiλλ1182-1184, while we derived an enrichment by up to a factor of seven (compared to the adopted baseline), from the same STIS spectrum. The N/C ratios, on the other hand, agree in both studies. Keeping the carbon and nitrogen abundances fixed, we constrained the mass-loss rate from N vλλ1248-1250 mostly, because the C iv resonance doublet shows no clear wind profile. An upper limit on the mass-loss rate Ṁ ≤ 3.5 × 10⁻⁹M⊙ yr-1 was found.
 |
Fig. A.9
Left: best-fit model for MPG 356 (red line) compared with the STIS spectrum (black line). Right: best-fit model for MPG 356 (red line) compared with the UVES spectrum (black line). |
| Open with DEXTER | |
Appendix A.10: AzV 429 – O7 V
AzV 429 is substantially more luminous than the other O7 V stars of the sample (see below and Table 2). It is also probably more evolved, as indicated by its position in the H-R diagram. Having only the UV spectrum for this star, our estimate of the surface gravity is based on the Fe v to Fe iv index from Heap et al. (2006) and suffers from higher uncertainty. The surface abundances of carbon and nitrogen are such that the N/C ratio is one of the lowest of the whole sample and only twice the interstellar value. Nitrogen is enhanced, but the carbon abundance is higher than listed in Kurt & Dufour (1998). The C ivλλ1548-1550 doublet presents a weak but well-defined wind profile. The best fit to this profile is obtained using Ṁ = 4.0 × 10⁻⁹M⊙ yr-1 and f = 0.05.
 |
Fig. A.10
Best-fit model for AzV 429 (red line) compared with the COS spectrum (black line). |
| Open with DEXTER | |
Appendix A.11: MPG 523 – O7 Vz
Our UVES spectrum of MPG 523 is not as strongly contaminated with nebular emission as was the FLAMES spectrum used in Mokiem et al. (2006). Both spectra can be best fitted with Teff = 38 700 K and a relatively high surface gravity, log g = 4.25. The fit to the helium lines is good except for He iλ5876, which is too broad in our model, while the observed profile also presents a warp on its blue side. The vsin i is moderate (50 km s-1) and consistent with the UV spectrum as well. This star is not listed as a potential or known binary, nor do we find it overluminous for its spectral type. We were unable to find a satisfactory explanation for this profile. The C ivλλ1548−1550 shows up as photospheric absorption, and the upper limit on the mass-loss rate is Ṁ = 6 × 10⁻⁹M⊙ yr-1.
Depending on the vrot used for stellar evolution models, the location of MPG 523 in the H-R diagram indicates contradictory ages, either very young (with an age younger than 1 Myr) or much older (with an age of about 5 Myr). On the other hand, the carbon and nitrogen surface abundances are characteristic of significantly more evolved status (carbon depleted and nitrogen enriched). The N/C ratio is one of the highest of the whole sample. We note that the C ivλ1169 is too weak in our model, however, but could not be matched by increasing the carbon abundance without degrading the fit to C iiiλ1176. The weak C iiiλλ4647−50−52 supports the low value for the carbon abundance.
 |
Fig. A.11
Left: best-fit model for MPG 523 (red line) compared with the STIS spectrum (black line). Right: best-fit model for MPG 523 (red line) compared with the UVES spectrum (black line). |
| Open with DEXTER | |
Appendix A.12: NGC 346-046 – O7 Vn
The luminosity and effective temperature we derived for NGC 346-046 indicates that this star is very close to the ZAMS, possibly leftward of the ZAMS within the error bars. Consistent with its spectral classification and with the results by Mokiem et al. (2006), this star has a very high rotation, the second highest of the sample, with vsin i = 300 km s-1. This strongly suggests that the evolutionary status of this star is to a large extent influenced by its rotation, possibly to the point of following chemically homogeneous evolution. However, our modeling does not indicate any departure from the initial helium abundance, which is inconsistent with such an evolution (and with Mokiem et al. 2006). The nitrogen-to-carbon ratio, though, is the highest of the whole sample. The C iv resonance doublet is present as a pure absorption profile, from which we derive an upper limit of Ṁ = 6 × 10⁻⁹M⊙ yr-1 for the mass-loss rate.
 |
Fig. A.12
Left: best-fit model for NGC 346-046 (red line) compared with the COS spectrum (black line). Right: best-fit model for NGC 346-046 (red line) compared with the FLAMES spectrum (black line). |
| Open with DEXTER | |
Appendix A.13: NGC 346-031 – O8 Vz
NGC 346-031 is the last member of the Vz class of our sample. We achieved a very good fit of both the UV and optical spectra and derived fundamental parameters such that its age is above 3 Myr, in contradiction with the expected youth of Vz class-members. In contrast to Mokiem et al. (2006), we did not find it necessary to increase the helium abundance, but instead found that the very low mass-loss rate we derived can explain the spectral classification in this parameter range (see Sect. 5.2.2).
 |
Fig. A.13
Best-fit model for NGC 346-031 (in red) compared with observed spectra (in black): the COS spectrum (upper left) and the FLAMESspectrum (upper right). The bottom plot shows a comparison with the UVES and FLAMES spectra for spectral regions around O iiiλ5592 (left), C iiiλ5696 (middle), and N iii – C iii features (right). |
| Open with DEXTER | |
Appendix A.14: AzV 461 – O8 V
The fundamental and wind parameters we derived for AzV 461 are close to those of NGC 346-031, but for the micro-turbulence and rotational velocity. For the effective temperature we derived from the UV analysis (see Sect. 3.2), He iλ4471 and He iiλ4686 are too weak, while He iiλ4200 and He iiλ4542 are well reproduced. Since the optical (2dF) spectrum is at lower resolution and S/N, we mostly relied on the COS spectrum to derive the fundamental parameters. The very close Teff and luminosities of AzV 461 and NGC 346-031 imply very close evolutionary status. Consistent with the higher vsin i, we derived a higher nitrogen enrichment and carbon depletion in AzV 461.
 |
Fig. A.14
Left: best-fit model for AzV 461 (red line) compared with the COS spectrum (black line). Right: best-fit model for AzV 461 (red line) compared with the 2dF spectrum (black line). |
| Open with DEXTER | |
Appendix A.15: MPG 299 – O8 Vn/O9 V
With vsin i = 360 km s-1, MPG 299 is the fastest rotator of our sample. The analysis of the FLAMES spectrum yields parameters in good agreement within the error bars with those by Mokiem et al. (2006). We confirm their conclusion that helium is enriched in MPG 299. Despite the significant centrifugal correction to the surface gravity, we found that the spectroscopic mass of MPG 299 agrees very well with its evolutionary mass. Although the location of MPG 299 in the H-R diagram indicates that it is a young object, we note that evolutionary tracks with initial vrot higher than 360 km s-1 should be considered in this specific case (see Sect. 5.2.1). For MPG 299, the nitrogen abundance is such that higher Ṁ would produce too strong a P Cygni profile at the N v resonance line, which is not observed.
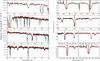 |
Fig. A.15
Left: best-fit model for MPG 299 (red line) compared with the COS spectrum (black line). Right: best-fit model for MPG 299 (red line) compared with the FLAMES spectrum (black line). |
| Open with DEXTER | |
Appendix A.16: MPG 487 – O8 V
MPG 487 was originally studied in the FUV and optical in Bouret et al. (2003), then Heap et al. (2006). Subsequently, Massey et al. (2009) used their own optical spectrum to provide a different analysis of this star. They argued that the cooler Teff we derived (along with Heap et al. 2006) was caused by a wrong correction of the moonlight continuum contribution that contaminates the AAT spectrum (same comments hold for MPG 368). Such a contribution was indeed present and mis-corrected in our initial study. On the other hand, the claim by Massey et al. (2009) that we were unable to obtain a satisfactory fit to the optical without assuming an unlikely low value for the metallicity, is wrong, as we demonstrate here. The metallicity was derived on the basis of the STIS spectrum analysis (see also Bouret et al. 2003), which is not affected by moonlight contamination. The derived value allows the best fit to the very weak lines of iron ions present on this STIS spectrum. Assuming higher metallicity would lead to an even lower Teff than the one we derived, hence increasing the discrepancy with the Massey et al. (2009) results. Moreover, the value quoted by these authors for the projected rotation rate of MPG 487 (vsin i = 160 km s-1) simply cannot be true (a typo, we assume). The lines of this star, whether in the FUV or in the optical are really narrow, indicating a vsin i that must be 20 km s-1 or even lower (see e.g. the C iiiλ1176 lines).
The SED of this star furthermore suggests that MPG 487 is a binary with a rather late-type companion (cf. Sect. 5.1). This conclusion was already mentioned in Bouret et al. (2003), although it was not as firmly established as it is now.
Finally, our new UVES spectrum of MPG 487 (cf. Sect. 2) does not suffer from moonlight contamination and has an excellent S/N. We still find the same value of Teff = 35 kK that we derived in Bouret et al. (2003). The surface gravity is higher than in Bouret et al. (2003) and more compatible with the value from Massey et al. (2009); we used the full line-set from the Balmer series to constrain this parameter. We also derived a non-standard abundance pattern for this star, with nitrogen being depleted while carbon seems enhanced compared with the standard chemical composition of HII regions of the SMC by Kurt & Dufour (1998).
 |
Fig. A.16
Left: best-fit model for MPG 487 (red line) compared with the COS spectrum (black line). Right: best-fit model for MPG 487 (red line) compared with the UVES spectrum (black line). |
| Open with DEXTER | |
Appendix A.17: AzV 267 – O8 V
With vsin i = 220 km s-1, AzV 267 is another fast rotator of the sample. Because we only had the UV COS spectrum for this star, we constrained the effective temperature from ratios between iron ions and C ivλ1169 to C iiiλ1176. Although it is a later-type O star, the C iv UV resonance doublet presents a clear absorption extending to the blue that we were able to use to constrain the mass-loss rate and the clumping filling factor. The fit to the N v resonance doublet is very good for the derived wind parameters. The terminal velocity we adopted to fit the lines is lower than for the other stars of the same type (i.e., with no wind detection).
 |
Fig. A.17
Best-fit model for AzV 267 (red line) compared with the COS spectrum (black line). |
| Open with DEXTER | |
Appendix A.18: AzV 468 – O8.5 V
Fundamental parameters were derived for the COS spectrum, except for the surface gravity, which we adopted as log g = 4.0, because no reliable diagnostics are present in the UV range. Because of the moderate vsin i of this star, photospheric iron and carbon lines are clearly defined and were used to constrain Teff to a good accuracy. The COS spectrum of AzV 468 shows no trace of wind, either at C iv or at N v resonance doublets. The derived mass-loss rate is indeed very low and is merely an upper limit.
 |
Fig. A.18
Best-fit model for AzV 468 (red line) compared with the COS spectrum (black line). |
| Open with DEXTER | |
Appendix A.19: MPG 682 – O9 V
The fit to the COS UVES and FLAMES spectra of MPG 682 is excellent, including the weak lines of N iiiλλ4634−42. Our Teff is cooler by 2000 K than the value reported in Mokiem et al. (2006), while log L/L⊙ are very similar. The wings of the hydrogen lines (including the Balmer series below 3860 Å) indicate that log g = 4.1, which yields a spectroscopic mass close to 27 M⊙, significantly higher than the evolutionary mass we derived from the H-R diagram (≈21 M⊙). The surface gravity quoted in Mokiem et al. (2006) is even higher (4.2 dex), but consistent with ours, within the error bars. The absence of UV wind profiles confirm that this star is in the weak-wind regime, as expected from its spectral type and luminosity class. Our mass-loss rate is about two orders of magnitude lower than the mass-loss rate in Mokiem et al. (2006).
 |
Fig. A.19
Best-fit model for MPG 682 (in red) compared with observed spectra (in black): the COS spectrum (upper left) and the FLAMES spectrum (upper right). The bottom plot shows a comparison with the UVES spectrum. |
| Open with DEXTER | |
Appendix A.20: AzV 326 – O9 V
AzV 326 is very likely a multiple star (see the discussion in Sect. 5.1). However, even when we corrected for a possible binary component, there were some remaining disagreement in the fit to the COS SED and we finally chose to normalize the spectrum, which we present in Fig. A.20). The fit to the individual spectral line from UV to the lower resolution 2dF spectrum in the optical is very good and we are confident that the derived parameters provide a meaningful representation of the primary component of this (yet hypothetical) system.
 |
Fig. A.20
Left: best-fit model for AzV 326 (red line) compared with the COS spectrum (black line). Right: best-fit model for AzV 326 (red line) compared with the 2dF spectrum (black line). |
| Open with DEXTER | |
 |
Fig. A.21
Left: best-fit model for AzV 189 (red line) compared with the COS spectrum (black line). Right: best-fit model for AzV 189 (red line) compared with the 2dF spectrum (black line). |
| Open with DEXTER | |
Appendix A.21: AzV 189 – O9 V
Here again, we are dealing with a potential binary. The correction applied assuming that this system consists of two identical components yields an excellent fit to the whole SED from UV to NIR with a single parameter set. For the same parameters, the fit to the optical 2dF spectrum is also very good. This spectrum was used to constrain the surface gravity. For the derived log g the spectroscopic mass is higher than the evolutionary mass. This could indicate that the adopted luminosity is too low, although a change by 0.1 dex in log g would also reconcile the two masses and is not excluded given the lower S/N and spectral resolution of the 2dF spectrum.
Appendix A.22: AzV 148 – O8.5 V
AzV 148 is the third star with photometry and UV flux unusual for its spectral type, and which would correspond to a luminosity typical of O6 V. The lower vsin i for this star allowed us to derive accurate Teff from ionization ratios, despite the lack of optical spectrum. The value we derived is consistent with those of the stars with spectral type O9 V. Surface gravity, on the other hand, was adopted as log g = 4.0, which translates into a spectroscopic mass significantly higher than the evolutionary mass. Like in AzV 189, though, a change by 0.1dex in log g would be enough to reconcile the two estimates. The C ivλλ1548-1550 line shows some blue extension, blueward of the interstellar components. The profile, together with the N v resonance profiles, is well reproduced by adopting a mass-loss rate three times higher than for the other O9 V stars of the sample.
 |
Fig. A.22
Best-fit model for AzV 148 (red line) compared with the COS spectrum (black line). |
| Open with DEXTER | |
Appendix A.23: MPG 012 – O9.5 V/B0 IV
This star was previously studied in the UV and optical in Bouret et al. (2003) and in the optical in Mokiem et al. (2006). The higher S/Ns of the UVES and FLAMES spectrum led us to revise log g (0.05 dex) slightly upward compared to Bouret et al. (2003), while Teff was unchanged. The fit to the three spectra is excellent except for He iλ5876; the synthetic profile is not as strong and broad as observed. This behavior cannot be explained at this point. The star is still the coolest and lowest gravity object of the whole sample. The fundamental parameters suggest a clearly evolved status for this object, as indicated by its age, the highest by far among the stars in NGC 346. The surface abundances are also typical of more advanced evolution, as noted in Bouret et al. (2003). Because it is at the outskirts of this H II region, this object might not be coeval with this region, as previously suggested by Walborn & Howarth (2000), Bouret et al. (2003), and Mokiem et al. (2006).
 |
Fig. A.23
Best-fit model for MPG 012 (in red) compared with observed spectra (in black): the STIS spectrum (upper left) and the FLAMES spectrum (upper right). The bottom plot shows a comparison with the UVES spectrum. |
| Open with DEXTER | |
© ESO, 2013
Current usage metrics show cumulative count of Article Views (full-text article views including HTML views, PDF and ePub downloads, according to the available data) and Abstracts Views on Vision4Press platform.
Data correspond to usage on the plateform after 2015. The current usage metrics is available 48-96 hours after online publication and is updated daily on week days.
Initial download of the metrics may take a while.