| Issue |
A&A
Volume 553, May 2013
|
|
|---|---|---|
| Article Number | A85 | |
| Number of page(s) | 18 | |
| Section | Extragalactic astronomy | |
| DOI | https://doi.org/10.1051/0004-6361/201220991 | |
| Published online | 14 May 2013 | |
Online material
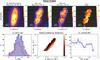 |
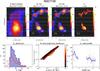
Fig. 1a
NGC 2369. Top panels show the SINFONI K band continuum emission, the observed maps (not corrected from extinction) of the lines Brγ at 2.166 μm and Brδ at 1.945 μm, together with the AV map. The white contour englobes those spaxels above S/N = 4 considered to build the AV map and distribution. The brightest spaxel of the K band continuum is marked with a plus symbol (+), and has been used as reference to obtain the radial profile in the bottom right panel. The secondary nucleus, if present, is marked with a cross (×). Bottom left panel shows the AV distribution of all valid spaxels (blue histogram) and the distributions of the those spaxels above (red) and below (yellow) the median value of the Brδ S/N distribution. The relationship between the surface brightness of the lines and the AV is shown in the central panel, where the points with AV < 0 are outlined with a black contour. Finally, the radial distribution of the extinction is shown in the bottom right panel, where the blue line represents the mean value of AV for different radial bins and its error. The bins are obtained as the 1/30 of the total radial coverage of the map. |
| Open with DEXTER | |
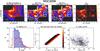 |
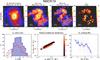
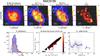
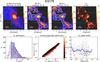
Fig. 1c
NGC 3256. Same as Fig. 1a but for NGC 3256. Please note that the central spaxel lays outside the FoV since the nucleus was not observed in K-band. See text and Paper I for further details. |
| Open with DEXTER | |
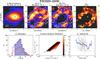 |
Fig. 1d
ESO 320-G030. Same as Fig. 1a but for ESO 320-G030. |
| Open with DEXTER | |
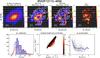 |
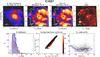
Fig. 1e
IRASF 12115-4656. Same as Fig. 1a but for IRASF 12115-4656. |
| Open with DEXTER | |
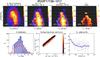 |
Fig. 1g
IRASF 17138-1017. Same as Fig. 1a but for IRASF 17138-1017. |
| Open with DEXTER | |
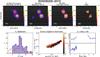 |
Fig. 2a
IRAS 06206-6315. Top panels show the SINFONI K band continuum emission, the observed maps (not corrected from extinction) of the lines Paα at 1.876 μm and Brγ at 2.166 μm, together with the AV map. The white contour englobes those spaxels above S/N = 4 considered to build the AV map and distribution. The brightest spaxel of the K band continuum is marked with a plus symbol (+), and has been used as reference to obtain the radial profile in the bottom right panel. The secondary nucleus, if present, is marked with a cross (×). Bottom left panel shows the AV distribution of all valid spaxels (blue histogram) and the distributions of the those spaxels above (red) and below (yellow) the median value of the Brγ S/N distribution. The relationship between the surface brightness of the lines and the AV is shown in the central panel, where the points with AV < 0 are outlined with a black contour. Finally, the radial distribution of the extinction is shown in the bottom right panel, where the blue line represents the mean value of AV for different radial bins and its error. The bins are obtained as the 1/30 of the total radial coverage of the map. For those objects with multiple components, the top inset shows the AV radial profile of the system taking the main nucleus as the centre, whereas the bottom subpanel shows the radial profile obtained by extracting the profiles of each component separately and plotting them in the same reference frame. |
| Open with DEXTER | |
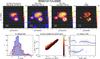 |
Fig. 2b
IRAS 12112+0305. Same as Fig. 2a but for IRAS 12112+0305. |
| Open with DEXTER | |
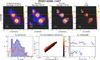 |
Fig. 2c
IRAS 14348-1447. Same as Fig. 2a but for IRAS 14348-1447. |
| Open with DEXTER | |
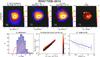 |
Fig. 2d
IRAS 17208-0014. Same as Fig. 2a but for IRAS 17208-0014. |
| Open with DEXTER | |
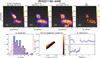 |
Fig. 2e
IRAS 21130-4446. Same as Fig. 2a but for IRAS 21130-4446. |
| Open with DEXTER | |
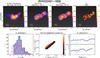 |
Fig. 2f
IRAS 22491-1808. Same as Fig. 2a but for IRAS 22491-1808. |
| Open with DEXTER | |
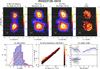 |
Fig. 2g
IRAS 23128-5919. Same as Fig. 2a but for IRAS 23128-5919. |
| Open with DEXTER | |
© ESO, 2013
Current usage metrics show cumulative count of Article Views (full-text article views including HTML views, PDF and ePub downloads, according to the available data) and Abstracts Views on Vision4Press platform.
Data correspond to usage on the plateform after 2015. The current usage metrics is available 48-96 hours after online publication and is updated daily on week days.
Initial download of the metrics may take a while.