Fig. 1a
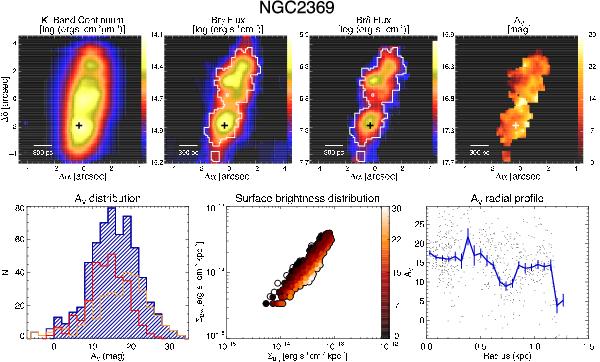
NGC 2369. Top panels show the SINFONI K band continuum emission, the observed maps (not corrected from extinction) of the lines Brγ at 2.166 μm and Brδ at 1.945 μm, together with the AV map. The white contour englobes those spaxels above S/N = 4 considered to build the AV map and distribution. The brightest spaxel of the K band continuum is marked with a plus symbol (+), and has been used as reference to obtain the radial profile in the bottom right panel. The secondary nucleus, if present, is marked with a cross (×). Bottom left panel shows the AV distribution of all valid spaxels (blue histogram) and the distributions of the those spaxels above (red) and below (yellow) the median value of the Brδ S/N distribution. The relationship between the surface brightness of the lines and the AV is shown in the central panel, where the points with AV < 0 are outlined with a black contour. Finally, the radial distribution of the extinction is shown in the bottom right panel, where the blue line represents the mean value of AV for different radial bins and its error. The bins are obtained as the 1/30 of the total radial coverage of the map.
Current usage metrics show cumulative count of Article Views (full-text article views including HTML views, PDF and ePub downloads, according to the available data) and Abstracts Views on Vision4Press platform.
Data correspond to usage on the plateform after 2015. The current usage metrics is available 48-96 hours after online publication and is updated daily on week days.
Initial download of the metrics may take a while.