| Issue |
A&A
Volume 553, May 2013
|
|
|---|---|---|
| Article Number | A129 | |
| Number of page(s) | 15 | |
| Section | The Sun | |
| DOI | https://doi.org/10.1051/0004-6361/201220804 | |
| Published online | 28 May 2013 | |
Online material
Appendix A: Time dependency of the pitch-angle cosine
The interaction of a charged particle with the fluctuation δB of an Alfvén wave forces the particle to leave its gyro orbit. This procedure is referred to pitch-angle scattering. Consequently the change of parallel momentum is connected to this process via  . Then the time derivative of p∥ is given by the Lorentz force
  (A.1)where Ep is the energy of the particle, which is assumed to be constant as the scattering is purely elastic. Since the parallel momentum remains constant during an unperturbed gyration, only the perpendicular momentum changes due to the circular movement p⊥ = px ± ipy = p⊥ 0exp [ ∓ i(φ0 − Ωt)]. This leads to a total change of μ for a particle with intial phase φ0 to the magnetic field with
  (A.2)(Lee & Lerche 1974). A similar approach is given by Schlickeiser (2002) using Eq. (19). In this case the solution along the characteristics of the generalised force term
  is given by Eq. (12.2.4b) Schlickeiser (2002). This result reduces to Eq. (A.2) by using the magnetostatic approximation, which assumes the electric field fluctuations to be negligible, δE = 0. The coordinates used are still Eqs. 20. The fluctuation δB, i.e. of an Alfvén wave as used in the presented case, is given in Fourier space by
  (A.3)The exponential function can be described by the generating Bessel functions Jn
 (A.4)where the argument of Jn is
  (A.5)and Ψ = cot-1(kx/ky),
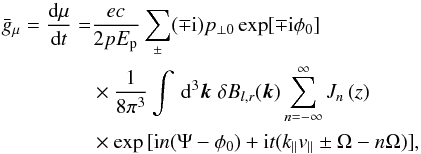
  . The total time derivative of the pitch-angle cosine, separated in parallel and perpendicular interactions, reads then
  (A.6)For Alfvén waves δB is aligned towards k × ezB0 and consequently δBl,r(k) = δB(k)( ∓ i)exp( ± iΨ). The time integration and the identity
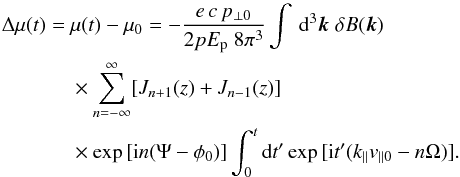
  (A.7)(Abramowitz & Stegun 1965) then gives the time dependency of the pitch-angle cosine with
  (A.8)The application of a purely parallel propagating wave, as shown in our toy model, will then simplify this equation because z(k⊥ = 0) = 0. Thus, all Bessel functions vanish, except J0(0) = 1. This is the case for n = ± 1. Furthermore, the k integration reduces by the assumption of a single wave
  , which leads to the presented form in Sect. 4.1.
Appendix B: Derivation of the pitch-angle diffusion coefficients
In the simulations, the turbulence consists of Alfvén and pseudo Alfvén waves, thus the pitch-angle diffusion coefficient must be calculated separately for the two modes. The two modes are decomposed using the method presented Maron & Goldreich (2001). For the pitch-angle diffusion coefficient for Alfvén waves, Schlickeiser (2002) gives  (B.1)where μ, v and Ω again are the particle’s pitch-angle cosine, speed, and gyrofrequency,
  , Pxx,A the xx-component of the Alfvén mode turbulence power spectrum tensor, and B0 the background magnetic field. For the resonance function ℛ(k,ω) we assume no damping, which gives the delta function ℛ(k,ω) = π δ(k∥v∥ − ω + nΩ). Thus, in the magnetostatic limit (ω = 0) we have
  (B.2)For the magnetosonic waves, Schlickeiser (2002) gives for the fast mode on the cold plasma limit
  (B.3)for high particle velocities, vA ≪ v. As the polarisation of the fast mode on the cold plasma limit is the same as for the pseudo Alfvén wave, it is straightforward to show that the same form also holds for the pseudo Alfvén waves, with the difference in the dispersion relation. However, by using the magnetostatic limit with ω = 0 and again assuming no damping, we get for the resonance function ℛ(k,ω) = πδ(k∥v∥ + Ω), thus giving for the diffusion coefficient
  (B.4)Unlike for the Alfvén waves, the Cherenkov resonance, n = 0, is nonzero for the pseudo Alfvén waves and has to be considered separately. In this case, the resonance function is
  (B.5)This results in
  (B.6)which has a singularity at v∥ = 0, and equals zero elsewhere. Consequently, this term is not used by our model.
For other terms in the sum over n, we again use the magnetostatic approximation ω = 0, thus giving the resonance condition  (B.7)and the pitch-angle diffusion coefficient
  (B.8)
(B.8)
Appendix C: Discretisation of the pitch-angle diffusion coefficients
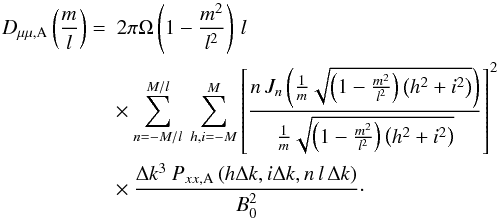
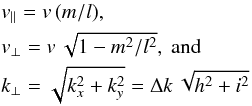
For the numerical calculation of the pitch-angle diffusion coefficient, we consider the spectrum to be continuous in parallel direction, but discrete in the perpendicular direction, i.e. Pxx(kx,ky,kz) = Pxx(hΔk,iΔk,kz), with h, i = −M,...,M. In this manner, the integrals over kx and ky can be written as a sum, while the integral over kz is evaluated using the delta function. Then, the diffusion coefficient for the Pseudo-Alfvén waves can be written as  (C.1)In this equation, (nΩ)/(μv) represents the parallel wavenumber at which δ(k∥v∥ + nΩ) is nonzero. Consequently, as turbulence data is available only at discrete wavenumbers, we define (nΩ)/(μv) = lΔk. Thus, with l restricted to integer values, we find the values of (v∥ = μv) at which the value of Dμμ can be solved. For a particle with v = Ω/(mΔk), with m ≤ l ≤ M, the pitch-angle is given as μ = m/l. Applying this discretisation, we have
and thus  (C.3)For the Alfvén waves, using the same discretisation, we get
  (C.4)
(C.4)
Appendix D: 5123 results
In this section we present the results of the investigation of the resolution by using a spatial grid of 5123 cells. Again, the MHD simulations were performed, first for the background turbulence, afterward with the peaked modes at  and 24. The results are in conformance with the other setups. In particular, we observed the generation of higher harmonic wave modes again.
 |
Fig. D.1
Two-dimensional magnetic energy spectra of the decay stage for both peaks in the simulation with |
| Open with DEXTER | |
These harmonics are also visible for the peak at  within the higher resolved simulation with a 5123 grid. In this simulation setup the number of active modes is eight times greater, which means the antialiasing edge is shifted by a factor two to k′ = 2π·86. Consequently, the higher harmonics at
  and 72 are visible. The evolution of the peaks in both simulations is comparable to the 2563 grid simulations. A dominant energy transport towards high perpendicular wavenumbers is observed.
 |
Fig. D.2
Scatter plots for the low |
| Open with DEXTER | |
The test particle simulations led to comparable resonance patterns. As presented in Fig. D.2 the resonant interactions at μR = 0,1 and − 0.95 are strongly tilted and a significant amount of particles reach the maximum Δμ, as indicated by the sharp thresholds. The scattering coefficient is in this case again without any structure and hence not shown here. The stronger scattering is primarily caused by the higher wave modes, which are not truncated by the antialiasing anymore and hence contribute to the wave-particle interactions. The test particle simulations were performed for the decay stage of the peaks only because of their huge computational effort.
 |
Fig. D.3
Scatter plots for the low |
| Open with DEXTER | |
Additionally, an increase of the scattering rate at the  peak within the 5123 grid was observed. Consequently, the resonances are not as significant as in the smaller grid. When comparing Fig. 9 and D.3 it is harder to recognize the resonant structures.
 |
Fig. D.4
Comparison between SQLT approach and particle simulation of the scattering coefficients Dαα for the low |
| Open with DEXTER | |
 |
Fig. D.5
Comparison between SQLT approach and particle simulation of the scattering coefficients Dαα for the low |
| Open with DEXTER | |
As discussed previously, the 5123 gridsize particle simulation within the decay stage led to strong effectively tilted resonances and consequently a very unstructured Dαα curve. This can be observed in both Figs. D.4 and D.5. Thus, the results differ greatly from those given by SQLT.
© ESO, 2013
Current usage metrics show cumulative count of Article Views (full-text article views including HTML views, PDF and ePub downloads, according to the available data) and Abstracts Views on Vision4Press platform.
Data correspond to usage on the plateform after 2015. The current usage metrics is available 48-96 hours after online publication and is updated daily on week days.
Initial download of the metrics may take a while.


