| Issue |
A&A
Volume 552, April 2013
|
|
|---|---|---|
| Article Number | L2 | |
| Number of page(s) | 6 | |
| Section | Letters | |
| DOI | https://doi.org/10.1051/0004-6361/201321110 | |
| Published online | 13 March 2013 | |
Online material
Appendix A: H2 line fluxes and spectra
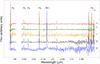 |
Fig. A.1
Continuum-subtracted spectra at five different positions along the outflow (see Fig. 1 and Table A.1). |
| Open with DEXTER | |
H2 line fluxes.
Appendix B: Outflow width and morphology
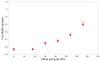 |
Fig. B.1
Width of the H2 1-0S(1) jet-like structure as a function of the distance from the source. The jet width has been estimated by extracting 2-pixel-wide vertical slices to the average H2 spectral image presented in Fig. 1 and fitting a single Gaussian function. Zero offsets correspond to the source positions. |
| Open with DEXTER | |
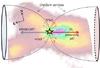 |
Fig. B.2
Sketch showing IRS54 outflow/jet morphology. |
| Open with DEXTER | |
© ESO, 2013
Current usage metrics show cumulative count of Article Views (full-text article views including HTML views, PDF and ePub downloads, according to the available data) and Abstracts Views on Vision4Press platform.
Data correspond to usage on the plateform after 2015. The current usage metrics is available 48-96 hours after online publication and is updated daily on week days.
Initial download of the metrics may take a while.