| Issue |
A&A
Volume 551, March 2013
|
|
|---|---|---|
| Article Number | A49 | |
| Number of page(s) | 26 | |
| Section | Interstellar and circumstellar matter | |
| DOI | https://doi.org/10.1051/0004-6361/201219210 | |
| Published online | 19 February 2013 | |
Online material
Appendix A
Appendix A.1: Rotational diagram analysis for levels in LTE and optically thick lines
We adopted the rotational diagram analysis that takes optical depth effects into account (also called population diagram analysis in Goldsmith & Langer 1999). A similar approach was taken by Goto et al. (2011). The line intensity emitted by a slab at a single temperature reads  (A.1)Bν is the Planck function at the excitation Tex = Trot = Tvib. The second term in the right-hand side is an optical depth correction factor to the optically thin rotational diagram. The term β = (1 − exp( − τν))/τν is akin to the escape probability. The maximum optical depth occurs at Erot ~ kTrot, where Erot is the rotational upper level energy of an emission line. In the Born-Oppenheimer approximation, Eu = Erot + Evib. The rotational energy for CO can be approximated by Erot = BrotJu(Ju + 1), with the rotational constant Brot = 2.76 K. The maximum optical depth occurs when
  . The line optical depth is
  (A.2)where ν is the line frequency, A the Einstein spontaneous emission probability of the transition, c the speed of light, Δv the turbulent width, N(CO) the CO column density, i the disc inclination, and
  (A.3)is the CO fractional population in the initial level (v′,J′). For CO, Qrot ≃ kTrot/BCO + 1/3 (BCO = 2.76 K) and Qvib = 1/(1 − exp( − 3122/Tvib) are the rotational and vibrational partition function respectively (Brittain et al. 2007).
The rotational diagram of AB Aur (Fig. A.1) shows three parts: a steep slope corresponding to increasing optical depth until Erot ~ kTex, then a shallow slope where the line optical depth decreases because the higher the rotational level, the less they are populated. At very high J, the slope steepens again. This behaviour also appears in our theoretical rotational diagrams, but the second turning point occurs at higher J than in the observations. The second slope change corresponds to lines with τ < 1. Assuming that the population is in LTE, we fitted the AB Aur rotational diagram by a model that takes the optical depth effects into account (Goldsmith & Langer 1999). The model parameters are the CO column density N(CO) = 4.2 × 1017 cm-2, the mean excitation temperature Tex ≃ 600 K (we assume that the vibrational temperature is equal to the rotational temperature), the turbulent width Δv = 0.05, and the inclination i = 30 degree. In the upper panel of Fig. A.1, the analytical solid curve compares well with the observations. The dashed-line curve shows the same model where optical depth effects are not taken into account. The lower panel shows the derived optical depths, which reach ~47.
Appendix A.2: Excitation, radiation, and gas kinetic temperatures
We define the radiation (brightness) temperature Trad at a given wavelength as the equivalent blackbody temperature that will match the specific intensity computed by the continuum radiative transfer at a given location in the disc (Figs. A.2 and A.3). We also show temperature ratios in Figs. A.4 and A.5: the excitation over the radiation and the excitation over the gas kinetic temperatures.
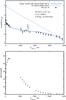 |
Fig. A.1
The upper panel shows the comparison between AB Aur and an analytical model rotational diagram for the 12CO v = 1 − 0 transitions observed by Brittain et al. (2003). The solid blue line shows the fit by an analytical model that takes optical depths into account. The results from the same model but without the effect of optical depth are shown in dashed blue line. The lower panel shows the derived line optical depth. |
| Open with DEXTER | |
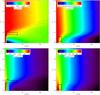 |
Fig. A.2
Radiation temperature Trad at 0.15 micron and 4.844 micron for the Mdisc = 10-2M⊙, Rin = 1 AU disc models (left panel) and for the Mdisc = 10-4M⊙, Rin = 1 AU disc models (right panel). The black contour shows the regions that emit 49% of the fluxes at 4.844 micron. The black dashed-line contours contain 70% of the fluxes in the vertical direction. |
| Open with DEXTER | |
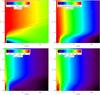 |
Fig. A.3
Radiation temperature Trad at 0.15 micron and 4.692 micron for the Mdisc = 10-2M⊙, Rin = 1 AU disc models (left panel) and for the Mdisc = 10-4M⊙, Rin = 1 AU disc models (right panel). The black contours show the regions that emit 49% of the fluxes at 4.692 micron. The black dashed-line contours contain 70% of the fluxes in the vertical direction. |
| Open with DEXTER | |
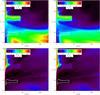 |
Fig. A.4
Tex(v = 1,J = 19)/Trad(4.844) (upper panels) and Tex(v = 1,J = 19)/Tgas (lower panels) structures for the Mdisc = 10-2M⊙, Rin = 1 AU disc models. The left panels correspond to the model with UV pumping and the right panels to models without UV pumping. The contours are labelled in red. The white contours encompass the regions that emit 49% of the fluxes at 4.844 micron. The dashed-line contours contain 70% of the fluxes in the vertical direction. |
| Open with DEXTER | |
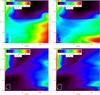 |
Fig. A.5
Tex(v = 1,J = 19)/Trad(4.844) (upper panels) and Tex(v = 1,J = 19)/Tgas (lower panels) structures for the Mdisc = 10-4M⊙, Rin = 1 AU disc models. The left panels correspond to the model with UV pumping and the right panels to models without UV pumping. The contours are labelled in red. The white contours encompass the regions that emit 49% of the fluxes at 4.844 micron. The dashed-line contours contain 70% of the fluxes in the vertical direction. |
| Open with DEXTER | |
© ESO, 2013
Current usage metrics show cumulative count of Article Views (full-text article views including HTML views, PDF and ePub downloads, according to the available data) and Abstracts Views on Vision4Press platform.
Data correspond to usage on the plateform after 2015. The current usage metrics is available 48-96 hours after online publication and is updated daily on week days.
Initial download of the metrics may take a while.