Fig. A.1
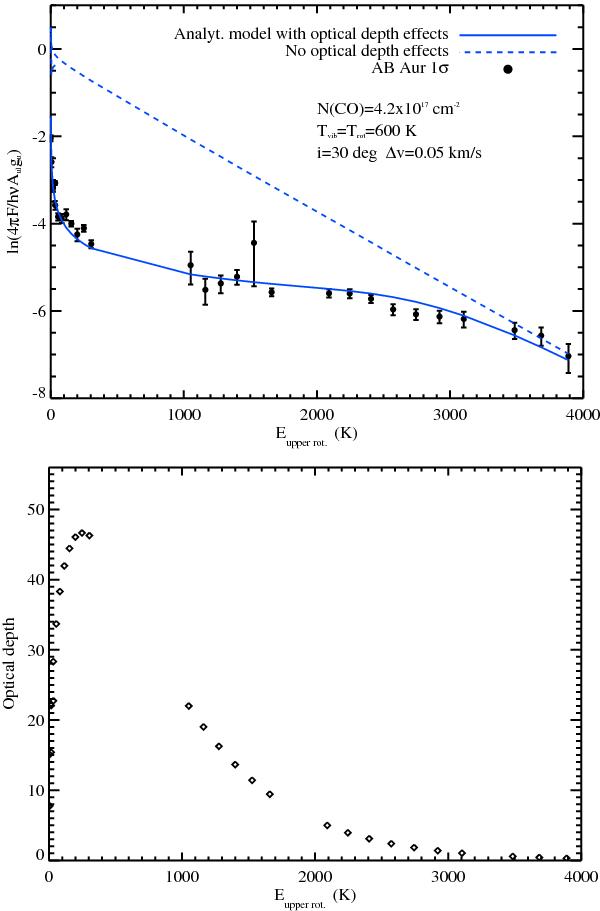
The upper panel shows the comparison between AB Aur and an analytical model rotational diagram for the 12CO v = 1 − 0 transitions observed by Brittain et al. (2003). The solid blue line shows the fit by an analytical model that takes optical depths into account. The results from the same model but without the effect of optical depth are shown in dashed blue line. The lower panel shows the derived line optical depth.
Current usage metrics show cumulative count of Article Views (full-text article views including HTML views, PDF and ePub downloads, according to the available data) and Abstracts Views on Vision4Press platform.
Data correspond to usage on the plateform after 2015. The current usage metrics is available 48-96 hours after online publication and is updated daily on week days.
Initial download of the metrics may take a while.