| Issue |
A&A
Volume 550, February 2013
|
|
|---|---|---|
| Article Number | A90 | |
| Number of page(s) | 10 | |
| Section | Stellar atmospheres | |
| DOI | https://doi.org/10.1051/0004-6361/201220529 | |
| Published online | 01 February 2013 | |
Online material
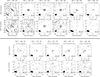 |
Fig. 1
Radio images of Cyg OB2 #9. For each of the 11 observations, we show the C-band (6 cm) image at the top, and the L-band image (20 cm) at the bottom. The observation date is shown in each title. Each image shows a small region centred on Cyg OB2 #9. The contour levels are listed at the top of each figure. They are shown as solid/dashed lines for positive/negative values. The levels were chosen so that the lowest positive level is at about 2 × the root-mean-square (rms) level. The highest level is below the peak flux value of Cyg OB2 #9. The synthesized beam is shown by the filled ellipse in the bottom left corner of each figure. The size of the image can be different for different figures (due to the changing configuration of the EVLA). |
| Open with DEXTER | |
© ESO, 2013
Current usage metrics show cumulative count of Article Views (full-text article views including HTML views, PDF and ePub downloads, according to the available data) and Abstracts Views on Vision4Press platform.
Data correspond to usage on the plateform after 2015. The current usage metrics is available 48-96 hours after online publication and is updated daily on week days.
Initial download of the metrics may take a while.