| Issue |
A&A
Volume 550, February 2013
|
|
|---|---|---|
| Article Number | A54 | |
| Number of page(s) | 12 | |
| Section | Planets and planetary systems | |
| DOI | https://doi.org/10.1051/0004-6361/201219434 | |
| Published online | 24 January 2013 | |
Online material
Appendix A: Correlation plots for the MCMC analysis
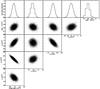 |
Fig. A.1
Correlations between different parameters from the MCMC analysis for night I. The baseline is modelled using a polynomial with coefficients c1 to c3. The correlation between the parameters and the amplitudes of the stellar pulsation at lower significance are not shown, since their impact on any of the measured parameters will be minimal. The amplitude for stellar pulsation is for a pulsation period of 62.00 min. |
| Open with DEXTER | |
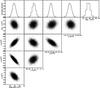 |
Fig. A.2
Same as Fig. A.1 but now for night II. The amplitude for stellar pulsation is for a pulsation period of 52.28 min. |
| Open with DEXTER | |
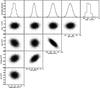 |
Fig. A.3
Correlations between different parameters from the MCMC analysis for night I. The baseline is modelled using the observed instrumental parameters. The correlation between the parameters and the amplitudes of the stellar pulsation at lower significance are not shown, since their impact on any of the measured parameters will be minimal. The amplitude for stellar pulsation is for a pulsation period of 63.95 min. |
| Open with DEXTER | |
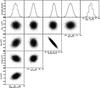 |
Fig. A.4
Same as Fig. A.3 but for night II. The amplitude for stellar pulsation is for a pulsation period of 52.65 min. |
| Open with DEXTER | |
© ESO, 2013
Current usage metrics show cumulative count of Article Views (full-text article views including HTML views, PDF and ePub downloads, according to the available data) and Abstracts Views on Vision4Press platform.
Data correspond to usage on the plateform after 2015. The current usage metrics is available 48-96 hours after online publication and is updated daily on week days.
Initial download of the metrics may take a while.