| Issue |
A&A
Volume 549, January 2013
|
|
|---|---|---|
| Article Number | A109 | |
| Number of page(s) | 75 | |
| Section | Planets and planetary systems | |
| DOI | https://doi.org/10.1051/0004-6361/201014704 | |
| Published online | 08 January 2013 | |
Online material
Sample.
Test for variability.
Test for periodicity.
Test for periodicity after subtraction of the best keplerian fit.
Keplerian solutions with various models.
Model comparison based on FAPs.
Model comparison based on false-alarm probabilities (FAP).
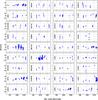 |
Fig. 3
Radial-velocity time series. |
| Open with DEXTER | |
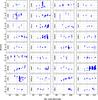 |
Fig. 3
continued. |
| Open with DEXTER | |
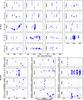 |
Fig. 3
continued. |
| Open with DEXTER | |
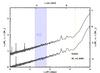 |
Fig. 13
Conservative detection limit applied to Gl 581. Planets with minimum mass above the limit are excluded with a 99% confidence level for all 12 trial phases. The upper curve shows the limit before any planetary signal is removed from the RV time series. The sharp decrease in detection sensitivity around the period of 5.3 days is caused by the RV signal of Gl 581b. The lower curve shows the limit after the best four-planet Keplerian fit has been subtracted. The sharp decrease in sensitivity around the period of two days is due to sampling. Both the Venus and Mars criteria delineate the habitable zone, which is shown in blue. The vertical yellow dashed line marks the duration of the survey. |
| Open with DEXTER | |
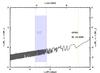 |
Fig. 14
Phase-averaged detection limit applied to Gl 581. Planets with minimum masses above the limit are excluded with a 99% confidence level for half of our 12 trial phases. The upper curve shows the limit before any planetary signal is removed from the RV time series. The sharp decrease in detection sensitivity around the period of 5.3 days is caused by the RV signal of Gl 581b. The lower curve shows the limit after the best four-planet Keplerian fit has been subtracted. The sharp decrease in sensitivity around the period of two days is due to sampling. The Venus and Mars criteria delineate the habitable zone, which is shown in blue. The vertical yellow dashed line marks the duration of the survey. |
| Open with DEXTER | |
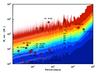 |
Fig. 15
Survey sensitivity derived from the combined phase-averaged detection limits for individual stars. Iso-contours are shown for 1, 10, 20, 30, 40, 50, 60, 70, 80, and 90 stars. Planets detected or confirmed by our survey are reported by red circles and labeled by their names. |
| Open with DEXTER | |
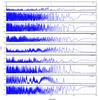 |
Fig. 16
Periodograms for RV time series with more than 6 measurements. |
| Open with DEXTER | |
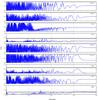 |
Fig. 16
continued. |
| Open with DEXTER | |
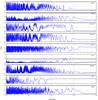 |
Fig. 16
continued. |
| Open with DEXTER | |
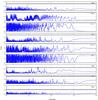 |
Fig. 16
continued. |
| Open with DEXTER | |
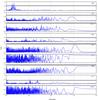 |
Fig. 16
continued. |
| Open with DEXTER | |
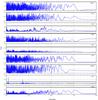 |
Fig. 16
continued. |
| Open with DEXTER | |
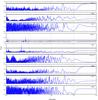 |
Fig. 16
continued. |
| Open with DEXTER | |
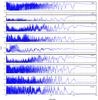 |
Fig. 16
continued. |
| Open with DEXTER | |
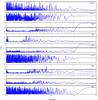 |
Fig. 16
continued. |
| Open with DEXTER | |
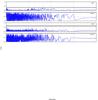 |
Fig. 16
continued. |
| Open with DEXTER | |
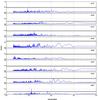 |
Fig. 17
Periodograms for RV time series with 1st Keplerian signal removed. |
| Open with DEXTER | |
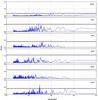 |
Fig. 17
continued. |
| Open with DEXTER | |
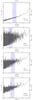 |
Fig. 18
Conservative detection limits on msini for time-series with more than four measurements. Planets above the limit are excluded, with a 99% confidence level, for all 12 trial phases. Some panels appear with two curves: the upper one is the detection limits before any model is subtracted and the bottom one is for the residuals around a chosen model (composed of planets, linear drifts, and/or a simple sine function). See Sect. 6 for details. |
| Open with DEXTER | |
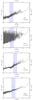 |
Fig. 18
continued. |
| Open with DEXTER | |
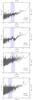 |
Fig. 18
continued. |
| Open with DEXTER | |
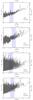 |
Fig. 18
continued. |
| Open with DEXTER | |
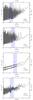 |
Fig. 18
continued. |
| Open with DEXTER | |
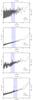 |
Fig. 18
continued. |
| Open with DEXTER | |
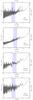 |
Fig. 18
continued. |
| Open with DEXTER | |
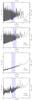 |
Fig. 18
continued. |
| Open with DEXTER | |
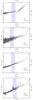 |
Fig. 18
continued. |
| Open with DEXTER | |
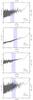 |
Fig. 18
continued. |
| Open with DEXTER | |
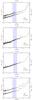 |
Fig. 18
continued. |
| Open with DEXTER | |
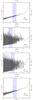 |
Fig. 18
continued. |
| Open with DEXTER | |
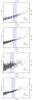 |
Fig. 18
continued. |
| Open with DEXTER | |
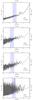 |
Fig. 18
continued. |
| Open with DEXTER | |
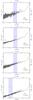 |
Fig. 18
continued. |
| Open with DEXTER | |
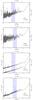 |
Fig. 18
continued. |
| Open with DEXTER | |
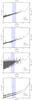 |
Fig. 18
continued. |
| Open with DEXTER | |
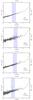 |
Fig. 18
continued. |
| Open with DEXTER | |
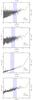 |
Fig. 18
continued. |
| Open with DEXTER | |
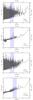 |
Fig. 18
continued. |
| Open with DEXTER | |
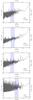 |
Fig. 18
continued. |
| Open with DEXTER | |
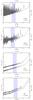 |
Fig. 18
continued. |
| Open with DEXTER | |
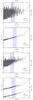 |
Fig. 18
continued. |
| Open with DEXTER | |
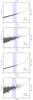 |
Fig. 18
continued. |
| Open with DEXTER | |
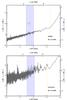 |
Fig. 18
continued. |
| Open with DEXTER | |
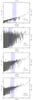 |
Fig. 19
Phase-averaged detection limits on msini for time-series with more than four measurements. Planets above the limit are statistically excluded, with a 99% confidence level, for half the 12 trial phases. Some panels display two curves: the upper one is the detection limits before any model is subtracted and the bottom one is for the residuals around a chosen model (composed of planets, linear drifts, and/or a simple sine function). See Sect. 6 for details. |
| Open with DEXTER | |
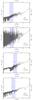 |
Fig. 19
continued. |
| Open with DEXTER | |
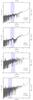 |
Fig. 19
continued. |
| Open with DEXTER | |
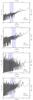 |
Fig. 19
continued. |
| Open with DEXTER | |
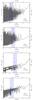 |
Fig. 19
continued. |
| Open with DEXTER | |
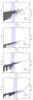 |
Fig. 19
continued. |
| Open with DEXTER | |
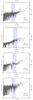 |
Fig. 19
continued. |
| Open with DEXTER | |
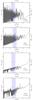 |
Fig. 19
continued. |
| Open with DEXTER | |
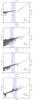 |
Fig. 19
continued. |
| Open with DEXTER | |
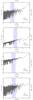 |
Fig. 19
continued. |
| Open with DEXTER | |
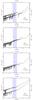 |
Fig. 19
continued. |
| Open with DEXTER | |
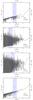 |
Fig. 19
continued. |
| Open with DEXTER | |
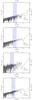 |
Fig. 19
continued. |
| Open with DEXTER | |
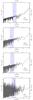 |
Fig. 19
continued. |
| Open with DEXTER | |
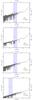 |
Fig. 19
continued. |
| Open with DEXTER | |
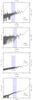 |
Fig. 19
continued. |
| Open with DEXTER | |
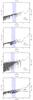 |
Fig. 19
continued. |
| Open with DEXTER | |
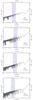 |
Fig. 19
continued. |
| Open with DEXTER | |
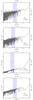 |
Fig. 19
continued. |
| Open with DEXTER | |
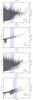 |
Fig. 19
continued. |
| Open with DEXTER | |
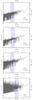 |
Fig. 19
continued. |
| Open with DEXTER | |
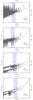 |
Fig. 19
continued. |
| Open with DEXTER | |
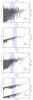 |
Fig. 19
continued. |
| Open with DEXTER | |
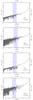 |
Fig. 19
continued. |
| Open with DEXTER | |
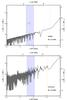 |
Fig. 19
continued. |
| Open with DEXTER | |
Appendix A: Comparison with published time series
Appendix A.1: Variability
Compared to other published time-series, we measured lower dispersions for all M dwarfs apart from Gl 846 and known planet-host stars. Gl 1 is not found to be variable in E06 and Z09 but their dispersion is limited by a higher photon noise (~2.6 m/s, against σe = 1.9 m/s in our case). We report some variability of Gl 229 but at a level of <1.9 m/s, while the variability reported in E06 and Z09 implies a jitter of 3.9–4.7 m/s. The slightly smaller dispersion we observe for Gl 357 (σe = 3.2 m/s) compared to 3.7 m/s and 5.3 m/s for E06 and Z09, respectively, might not be significant given our small number of observations (6). For Gl 551, we measured only a dispersion slightly smaller (3.3 against 3.6 m/s). We observe significantly lower variability for Gl 682 (1.8 against 3.6 m/s) and Gl 699 (1.7 against 3.4 and 3.3 m/s), and a larger dispersion for Gl 846 (5.6 against 3.0 m/s). Although different time-spans, epochs of observations and activity levels at those epochs could explain the different dispersions for individual stars (as is certainly the case for Gl 846 – see Sect. 5.2), that we measure a smaller dispersion for most comparison stars most likely reflects the superior performance of the HARPS spectrograph.
Linear trends for the time series of stars common to Zechmeister et al. (2009, Z09) and this paper.
Appendix A.2: Trends
As in this paper, Z09 reported non-significant slopes for Gl 357 and Gl 682 and significant slopes for Gl 1, Gl 551, and Gl 699 (although in our case Gl699 is attributed a significant trend only by the F-test). Nonetheless, the slopes that Z09 reported for Gl 551 and Gl 699 seem different and they moreover found a significant trend for Gl 229, whereas we do not. Time series have also been published for Gl 832 and Gl 849 as they were they were identified as likely hosts of orbiting planet (Bailey et al. 2009; Butler et al. 2006). For both stars, the planetary reflex motion clearly dominates the radial velocity signal so we discard them from any quantitative comparison. In Table A.1, we compare the slopes of linear fits to the time series in Z09 and to those of this paper. We note that the significant differences most often reflect a signal more complex than a simple linear drift.
Appendix A.3: Periodicity
Among stars with identified periodicity in RV data, Gl 832, Gl 849, and Gl 876 have time series published to report on detected planets. The periodicities we have found for those three stars are similar to their planetary orbital periods. Only Gl 876d is undetected with our automated procedure because one has to do a full N-body integration to subtract properly the signal induced by planets “b” and “c”. Besides known planet hosts, Z09 also report an absence of periodicities for Gl 229, Gl 357, Gl 433, and Gl 682, and significant periodicities for Gl 551 and Gl 699. Our results and Z09 are therefore in contradiction for three stars: Gl 433, Gl 551 and Gl 699. We noted in Sect. 5.1 that, for Gl 433, the RVs reported by Z09 and in this paper are not incompatible provided that the merged data set is fitted by a model composed of one planet plus a quadratic drift. The about one-year periodicity found for Gl 551 by Z09 and Endl & Kürster (2008) led these authors to attribute the signal to an alias of a low frequency signal with the typical one-year sampling. After Endl & Kürster (2008), the low frequency signal is believed to be caused by a clustering of points that are both blue-shifted and have a higher Hα index than other points in the time series. This putative activity signal might not be seen in our time series because it represented by only 24 measurements, against 229 in Z09. Finally, the periodicity found for Gl 699 is also attributed to activity, with a clear counterpart in Hα filling factor. In addition, if that activity signal is not seen in our time series, it is likely because it is represented by only 22 measurements, compared to 226 for Z09.
© ESO, 2013
Current usage metrics show cumulative count of Article Views (full-text article views including HTML views, PDF and ePub downloads, according to the available data) and Abstracts Views on Vision4Press platform.
Data correspond to usage on the plateform after 2015. The current usage metrics is available 48-96 hours after online publication and is updated daily on week days.
Initial download of the metrics may take a while.