Free Access
Fig. 15
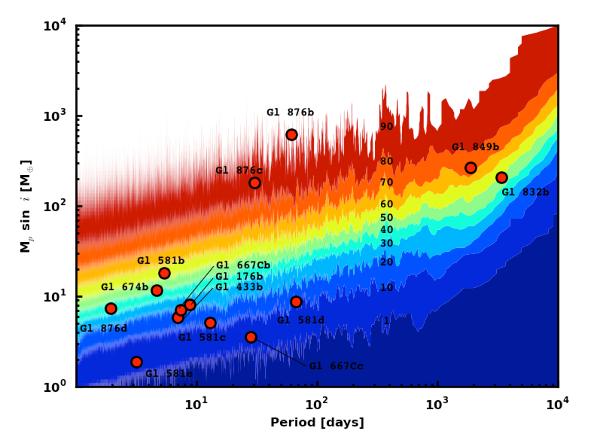
Survey sensitivity derived from the combined phase-averaged detection limits for individual stars. Iso-contours are shown for 1, 10, 20, 30, 40, 50, 60, 70, 80, and 90 stars. Planets detected or confirmed by our survey are reported by red circles and labeled by their names.
Current usage metrics show cumulative count of Article Views (full-text article views including HTML views, PDF and ePub downloads, according to the available data) and Abstracts Views on Vision4Press platform.
Data correspond to usage on the plateform after 2015. The current usage metrics is available 48-96 hours after online publication and is updated daily on week days.
Initial download of the metrics may take a while.