| Issue |
A&A
Volume 548, December 2012
|
|
|---|---|---|
| Article Number | L6 | |
| Number of page(s) | 6 | |
| Section | Letters | |
| DOI | https://doi.org/10.1051/0004-6361/201220504 | |
| Published online | 27 November 2012 | |
Online material
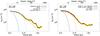 |
Fig. 4
Left: mean radial column density profile measured on the eastern side of the Vela C ridge in the 11.5′′ resolution column density map shown in Fig. 2 (right). This figure is complementary to Fig. 3 for the side containing the OB cluster. This profile has a p value of 2.3 ± 0.5 and Rflat = 0.05 ± 0.02 pc. The error bars in yellow show the dispersion of the radial profile along the filament, while the lines on the plot are as per Fig. 3 and as indicated on the key. Right: comparison of the mean background-subtracted radial profiles measured on the western side of the Vela C ridge in the 11.5′′ resolution column density map (black curve and yellow error bars) and in the 36.3′′ resolution column density map (orange curve). The black and orange dash-dotted curves represent the effective 11.5′′ and 36.3′′ HPBW resolutions of the corresponding data, respectively. |
| Open with DEXTER | |
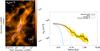 |
Fig. 5
Left: column density map of the Serpens South filament (36′′ resolution) derived from HGBS data (see Könyves et al. 2010), with the corresponding topological filament identified overlaid in blue. Right: mean radial density profile (taken from both sides of the filament) measured perpendicular to the supercritical Serpens South filament (left) shown here in log-log format. Lines and colour coding are consistent with Figs. 3 and 4. The Gaussian fit to the inner part of the profile (dotted blue curve) has a deconvolved FWHM width 0.10 ± 0.05 pc. The best Plummer-like model fit (dashed red curve) has an inner radius Rflat ~ 0.03 ± 0.01 pc and a power-law index p = 2.02 ± 0.27. |
| Open with DEXTER | |
© ESO, 2012
Current usage metrics show cumulative count of Article Views (full-text article views including HTML views, PDF and ePub downloads, according to the available data) and Abstracts Views on Vision4Press platform.
Data correspond to usage on the plateform after 2015. The current usage metrics is available 48-96 hours after online publication and is updated daily on week days.
Initial download of the metrics may take a while.