Fig. 5
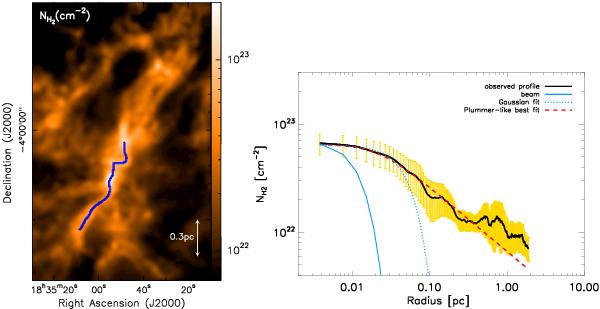
Left: column density map of the Serpens South filament (36′′ resolution) derived from HGBS data (see Könyves et al. 2010), with the corresponding topological filament identified overlaid in blue. Right: mean radial density profile (taken from both sides of the filament) measured perpendicular to the supercritical Serpens South filament (left) shown here in log-log format. Lines and colour coding are consistent with Figs. 3 and 4. The Gaussian fit to the inner part of the profile (dotted blue curve) has a deconvolved FWHM width 0.10 ± 0.05 pc. The best Plummer-like model fit (dashed red curve) has an inner radius Rflat ~ 0.03 ± 0.01 pc and a power-law index p = 2.02 ± 0.27.
Current usage metrics show cumulative count of Article Views (full-text article views including HTML views, PDF and ePub downloads, according to the available data) and Abstracts Views on Vision4Press platform.
Data correspond to usage on the plateform after 2015. The current usage metrics is available 48-96 hours after online publication and is updated daily on week days.
Initial download of the metrics may take a while.