Free Access
| Issue |
A&A
Volume 545, September 2012
|
|
|---|---|---|
| Article Number | A10 | |
| Number of page(s) | 15 | |
| Section | Extragalactic astronomy | |
| DOI | https://doi.org/10.1051/0004-6361/201218812 | |
| Published online | 28 August 2012 | |
Online material
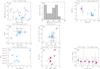 |
Fig. 9
Set of plots showing different relations between observables. The plots are described in Sect. 4.2. In all plots, the cyan dots correspond to the sources M4, M5, M5-2 to M5-4 and M6. The red dots correspond to the apertures chosen in the H2 image. |
| Open with DEXTER | |
© ESO, 2012
Current usage metrics show cumulative count of Article Views (full-text article views including HTML views, PDF and ePub downloads, according to the available data) and Abstracts Views on Vision4Press platform.
Data correspond to usage on the plateform after 2015. The current usage metrics is available 48-96 hours after online publication and is updated daily on week days.
Initial download of the metrics may take a while.