| Issue |
A&A
Volume 544, August 2012
|
|
|---|---|---|
| Article Number | L15 | |
| Number of page(s) | 6 | |
| Section | Letters | |
| DOI | https://doi.org/10.1051/0004-6361/201219744 | |
| Published online | 10 August 2012 | |
Online material
Appendix A: Data reduction and HIFI calibration
The comet was tracked using an up-to-date ephemeris provided by the JPL Horizons system. The Herschel rms pointing accuracy is approximately 1′′.
The data were reduced to level 2 products using the Herschel Interactive Processing Environment (HIPE 7.3). All lines were observed in the two orthogonal H and V polarizations. The two orthogonal polarizations were averaged. Note that the two polarizations are observed with different mixers, and their respective apertures are imperfectly co-aligned. The beam offset for the H and V average spectra is ~ 4′′ with respect to the pointed position.
The line intensities integrated over velocity were computed on the main-beam brightness-temperature scale using beam efficiencies of 0.75 and 0.73 for bands a and 4a, respectively, and a forward efficiency of 0.96. Based on the calibration error budget (Roelfsema et al. 2012), a conservative value for the uncertainty in the absolute intensity calibration is 10% for both bands. Most sources of errors are eliminated when comparing band 1a data, and the relative uncertainty is at most 5% in this case (sideband ratio, hot-load coupling, and temperature). Finally, the calibration uncertainty for the ratio of band 1a to band 4a lines is 10%.
Appendix B: Water production rate: comparison with other measurements
Water production rates measured for C/2009 P1 (Garradd) from September to October 2011 are shown in Fig. B.1. Reported values include retrievals from OH 18-cm observations (Colom et al. 2011, and in prep.), OH narrowband photometry (Schleicher et al., personal communication), and near-IR observations of water (DiSanti et al. 2012; Paganini et al. 2012; Villanueva et al. 2012). Herschel/HIFI and OH 18-cm observations, which were acquired close in date, provide consistent values. The data suggest that the activity of comet Garradd underwent significant variations, and reached a maximum at the time the HIFI observations were performed. The 987 GHz H2O line observed with HIFI was also observed on 16 October 2011
with the Spectral and Photometric Imaging Receiver (SPIRE) aboard Herschel; the line intensity is ~40% weaker than on 6 October 2011, when the HIFI measurements were conducted (Swinyard et al., in prep.), implying a water production rate consistent with the value measured from OH narrowband photometry on 18 and 20 October 2011 (65 days before perihelion, Fig. B.1). The low values derived from the near-IR measurements, compared to other measurements, possibly reflect sublimation from short-lived icy grains in the inner coma since the field-of-view for these observations was much smaller (by a factor of ten or more) than for the other techniques.
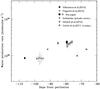 |
Fig. B.1
Water production rates measured pre-perihelion in comet C/2009 P1 (Garradd). The time is with respect to the perihelion (23 December 2011). The plain and empty circles correspond to the 6-October single-point and mapping HIFI observations, respectively, analysed with the model with Tlaw. |
| Open with DEXTER | |
© ESO, 2012
Current usage metrics show cumulative count of Article Views (full-text article views including HTML views, PDF and ePub downloads, according to the available data) and Abstracts Views on Vision4Press platform.
Data correspond to usage on the plateform after 2015. The current usage metrics is available 48-96 hours after online publication and is updated daily on week days.
Initial download of the metrics may take a while.