| Issue |
A&A
Volume 544, August 2012
|
|
|---|---|---|
| Article Number | L9 | |
| Number of page(s) | 5 | |
| Section | Letters | |
| DOI | https://doi.org/10.1051/0004-6361/201219615 | |
| Published online | 06 August 2012 | |
Online material
Appendix A: Slab model
For an optically thin line from a point-like source, the flux can be written by
 (A.1)for the solid angle of the source dΩs, the line frequency νul, the Einstein-A coefficient Aul, the molecular column density Nmol, the statistical weight of the upper level gu, the energy of the upper level Eu, and the partition function Q(T). The solid angle of the emitting region can be written as dΩs ≡ πr2/d2, for the radius of the emitting region r and a distance of d = 118 pc to HD 163296. For an optically thick line, the integrated intensity is obtained from
  (A.2)where the opacity at the line center is
  (A.3)The (thermal) width of the lines is assumed to be Δv ~ 1 km s-1, which is appropriate for gas at several hundred K and we assume a simple square-like line profile as e.g. used in the RADEX code (van der Tak et al. 2007).
Appendix B: False alarm probability of water detection in the stacked spectrum
We performed a simulation to measure the probability of detecting a signal with an integrated value, S > 7σ. This provides the false alarm probability (FAP) of a detection based on the stacked spectrum. We performed 10 000 random stackings of 54 (equal
to the number of water lines) parts of the PACS spectrum of HD 163296. After 10 000 iterations, we measured the distribution of the ratio of the integrated signal to its uncertainty (measured as in Sect. 3.1). We masked the bins containing H2O, OH, and [O i] emission. Figure B.1 shows the distribution of S/σ. The distribution is well-fitted by a Gaussian function (red line,  ), centered (as expected) at S/σ = 0 (i.e. an equal number of positive and negative peaks). The number of occurrences with S/σ > 7 is less than thee, which corresponds to FAP < 0.03% according to Bayesian statistics.
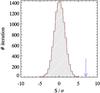 |
Fig. B.1
Distribution of S/σ after 10,000 random stackings of 54 parts of the PACS spectrum of HD 163296. The red line shows the Gaussian fit. The arrow indicates the location of the H2O signal (Fig. 2). |
| Open with DEXTER | |
© ESO, 2012
Current usage metrics show cumulative count of Article Views (full-text article views including HTML views, PDF and ePub downloads, according to the available data) and Abstracts Views on Vision4Press platform.
Data correspond to usage on the plateform after 2015. The current usage metrics is available 48-96 hours after online publication and is updated daily on week days.
Initial download of the metrics may take a while.