| Issue |
A&A
Volume 544, August 2012
|
|
|---|---|---|
| Article Number | A93 | |
| Number of page(s) | 48 | |
| Section | Interstellar and circumstellar matter | |
| DOI | https://doi.org/10.1051/0004-6361/201118555 | |
| Published online | 03 August 2012 | |
Online material
Lines observed during the quiescence phase (pre- and post-outburst).
Lines observed during the outburst phase, grouped according to element.
Appendix A: Gaussian fits to the emission lines in outburst
We describe here in detail the three Gaussian fits to the independent lines in the outburst, and present a few more examples of the resulting best fits to some of the metallic lines (see Figs. A.1 to A.5). The fits were done with IRAF task ngaussfit, restricting the fitting range to ±250 km s-1 (or less, in the case of proximity to another feature). The fitting was done interactively, paying special attention to the continuum and the presence of the NC. The model fitted to the data can be written as 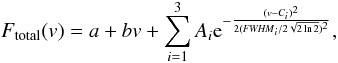 (A.1)where a and b are the continuum level and slope, Ai are the amplitudes of the different Gaussian components, Ci are the Gaussian centers (in velocity), and FWHMi are the FWHM of the three Gaussian components. The full collection of best fits to the lines unaffected by blending is shown in Table A.1. While the BC of neutral and ionized metallic lines observed in May
2008 are strongly consistent with two broad Gaussian components with variable velocities, the April and June observations in 2008 were not so uniquely defined. Fitting in terms of a single broad component plus either a narrower blueshifted or redshifted absorption component typically provides the best fits to the metallic lines (and would be a signature of wind and infall, respectively), but we cannot a priori rule out an interpretation in terms of two Gaussian emission components. In several cases during these two dates, a simple three Gaussian fit to all the components in emission fails to reproduce the blueshifted and redshifted absorption profiles observed, which reinforces the interpretation of the line profiles in terms of wind- and infall-related absorption. In addition, in some other cases, the fits are not unique (e.g. Fe II line on April 21, see Table A.1).
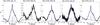 |
Fig. A.1
Mg I 4702 Å line: results of the fit with three Gaussian components for the different outburst epochs. The original data is shown as the bold line, individual Gaussians are marked by dotted lines, and the final fit is shown as a dashed line. |
| Open with DEXTER | |
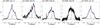 |
Fig. A.2
Fe I 6065 Å line: results of the fit with three Gaussian components for the different outburst epochs. The original data is shown as the bold line, individual Gaussians are marked by dotted lines, and the final fit is shown as a dashed line. |
| Open with DEXTER | |
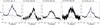 |
Fig. A.3
Ca I 6718 Å line: results of the fit with three Gaussian components for the different outburst epochs. The original data is shown as the bold line, individual Gaussians are marked by dotted lines, and the final fit is shown as a dashed line. |
| Open with DEXTER | |
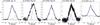 |
Fig. A.4
Fe II 6084 Å line: results of the fit with three Gaussian components for the different outburst epochs. The original data is shown as the bold line, individual Gaussians are marked by dotted lines, and the final fit is shown as a dashed line. |
| Open with DEXTER | |
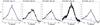 |
Fig. A.5
Si II 6347 Å line: results of the fit with three Gaussian components for the different outburst epochs. The original data is shown as the bold line, individual Gaussians are marked by dotted lines, and the final fit is shown as a dashed line. Note that the blueshifted emission that appears on June 16 is probably due to contamination by a weaker, blended line that became visible as the continuum and BC strength decreased. |
| Open with DEXTER | |
On the other hand, the H I and He I lines appear much more symmetric than the metallic lines at all dates, and the asymmetries that could be potentially interpreted as independent components do not show any clear dynamical pattern in the different observations, which clearly distinguishes them from the metallic lines.
Gaussian fits.
© ESO, 2012
Current usage metrics show cumulative count of Article Views (full-text article views including HTML views, PDF and ePub downloads, according to the available data) and Abstracts Views on Vision4Press platform.
Data correspond to usage on the plateform after 2015. The current usage metrics is available 48-96 hours after online publication and is updated daily on week days.
Initial download of the metrics may take a while.