Free Access
Fig. A.3
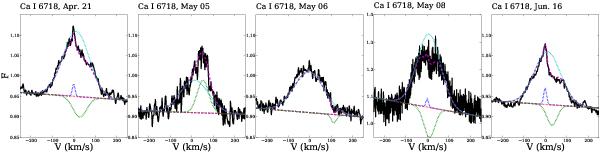
Ca I 6718 Å line: results of the fit with three Gaussian components for the different outburst epochs. The original data is shown as the bold line, individual Gaussians are marked by dotted lines, and the final fit is shown as a dashed line.
Current usage metrics show cumulative count of Article Views (full-text article views including HTML views, PDF and ePub downloads, according to the available data) and Abstracts Views on Vision4Press platform.
Data correspond to usage on the plateform after 2015. The current usage metrics is available 48-96 hours after online publication and is updated daily on week days.
Initial download of the metrics may take a while.