| Issue |
A&A
Volume 543, July 2012
|
|
|---|---|---|
| Article Number | A33 | |
| Number of page(s) | 31 | |
| Section | Extragalactic astronomy | |
| DOI | https://doi.org/10.1051/0004-6361/201118690 | |
| Published online | 22 June 2012 | |
Online material
Appendix A: CO moment 0 maps
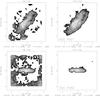 |
Fig. A.1
CO moment 0 maps of NGC 4501 and NGC 4402. Left panels: resulting from clipping the CO data cube at a constant level of 75 mK. Right panels: after the procedure described in Sect. 2.1 involving the Hi data cubes. |
| Open with DEXTER | |
Appendix B: The star formation efficiency of the sample galaxies
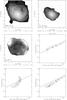 |
Fig. B.1
NGC 4254: top left: star formation rate (from UV+TIR) in contours on a greyscale map of the total gas surface density. Contour levels are (1,2,4,8,16,32,64,128) 3 × 10⁻⁴ M⊙ kpc-2 pc-1. Greyscale levels are (1,2,4,8,16,32,64,128) M⊙ pc-2. Top right: total gas surface density contours on the molecular gas fraction ΣH2/ΣHI. Greyscale levels are (1,2,4,8,16,32,64) × 0.1. Middle left: total gas surface density contours on the star formation timescale |
| Open with DEXTER | |


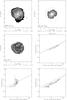 |
Fig. B.2
NGC 4321: top left: star formation rate (from UV+TIR) in contours on a greyscale map of the total gas surface density. Contour levels are (1,2,4,8,16,32,64,128) 3 × 10⁻⁴ M⊙ kpc-2 pc-1. Greyscale levels are (1,2,4,8,16,32,64,128) M⊙ pc-2. Top right: total gas surface density contours on the molecular gas fraction ΣH2/ΣHI. Greyscale levels are (1,2,4,8,16,32,64,128) × 0.1. Middle left: total gas surface density contours on the star formation timescale |
| Open with DEXTER | |
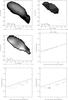 |
Fig. B.3
NGC 4330: top left: star formation rate (from UV+TIR) in contours on a greyscale map of the total gas surface density. Contour levels are (1,2,4,8,16) 3 × 10⁻⁴ M⊙ kpc-2 pc-1. Greyscale levels are (1,2,4,8,16) M⊙ pc-2. Top right: total gas surface density contours on the molecular gas fraction ΣH2/ΣHI. Greyscale levels are (1,2,4) × 0.1. Middle left: total gas surface density contours on the star formation timescale |
| Open with DEXTER | |
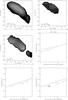 |
Fig. B.4
NGC 4330: top left: star formation rate based on Hα and TIR emission in contours on a greyscale map of the total gas surface density. Contour levels are (1,2,4,8,16) 5 × 10⁻⁴ M⊙ kpc-2 pc-1. Greyscale levels are (1,2,4,8,16) M⊙ pc-2. Top right: total gas surface density contours on the molecular gas fraction ΣH2/ΣHI. Greyscale levels are (1,2,4) × 0.1. Middle left: total gas surface density contours on the star formation timescale |
| Open with DEXTER | |
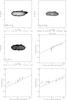 |
Fig. B.5
NGC 4402: top left: star formation rate (from UV+TIR) in contours on a greyscale map of the total gas surface density. Contour levels are (1,2,4,8,16,32) 8 × 10⁻⁴ M⊙ kpc-2 pc-1. Greyscale levels are (1,2,4,8,16,32,64,128) M⊙ pc-2. Top right: total gas surface density contours on the molecular gas fraction ΣH2/ΣHI. Greyscale levels are (1,2,4,8,16,32) × 0.1. Middle left: total gas surface density contours on the star formation timescale |
| Open with DEXTER | |
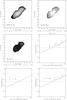 |
Fig. B.6
NGC 4419: top left: star formation rate (from UV+TIR) in contours on a greyscale map of the total gas surface density. Contour levels are (1,2,4,8,16,32) 5 × 10⁻³ M⊙ kpc-2 pc-1. Greyscale levels are (1,2,4,8,16,32,64) M⊙ pc-2. Top right: total gas surface density contours on the molecular gas fraction ΣH2/ΣHI. Greyscale levels are (1,2,4,8,16,32,64,128) × 0.1. Middle left: total gas surface density contours on the star formation timescale |
| Open with DEXTER | |
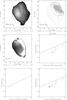 |
Fig. B.7
NGC 4438: top left: star formation rate (from UV+TIR) in contours on a greyscale map of the total gas surface density. Contour levels are (1,2,4,8,16,32) 4.5 × 10⁻⁴ M⊙ kpc-2 pc-1. Greyscale levels are (1,2,4,8,16,32,64) M⊙ pc-2. Top right: total gas surface density contours on the molecular gas fraction ΣH2/ΣHI. Greyscale levels are (1,2,4,8,16,32,64,128) × 0.1. Middle left: total gas surface density contours on the star formation timescale |
| Open with DEXTER | |
 |
Fig. B.8
NGC 4438: top left: star formation rate based on Hα and TIR emission in contours on a greyscale map of the total gas surface density. Contour levels are (1,2,4,8,16,32) 15 × 10-4 M⊙ kpc-2 pc-1. Greyscale levels are (1,2,4,8,16,32) M⊙ pc-2. Top right: total gas surface density contours on the molecular gas fraction ΣH2/ΣHI. Greyscale levels are (1,2,4,8) × 0.1. Middle left: total gas surface density contours on the star formation timescale |
| Open with DEXTER | |
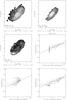 |
Fig. B.9
NGC 4501: top left: star formation rate (from UV+TIR) in contours on a greyscale map of the total gas surface density. Contour levels are (1,2,4,8,16,32,64) 5 × 10⁻⁴ M⊙ kpc-2 pc-1. Greyscale levels are (1,2,4,8,16,32,64) M⊙ pc-2. Top right: total gas surface density contours on the molecular gas fraction ΣH2/ΣHI. Greyscale levels are (1,2,4,8,16,32,64,128) × 0.1. Middle left: total gas surface density contours on the star formation timescale |
| Open with DEXTER | |
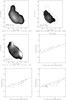 |
Fig. B.10
NGC 4522: top left: star formation rate (from UV+TIR) in contours on a greyscale map of the total gas surface density. Contour levels are (1,2,4,8,16,32) 3 × 10⁻⁴ M⊙ kpc-2 pc-1. Greyscale levels are (1,2,4,8,16,32) M⊙ pc-2. Top right: total gas surface density contours on the molecular gas fraction ΣH2/ΣHI. Greyscale levels are (1,2,4,8) × 0.1. Middle left: total gas surface density contours on the star formation timescale |
| Open with DEXTER | |
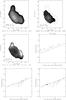 |
Fig. B.11
NGC 4522: top left: star formation rate based on Hα and TIR emission in contours on a greyscale map of the total gas surface density. Contour levels are (1,2,4,8,16,32) 6 × 10⁻⁴ M⊙ kpc-2 pc-1. Greyscale levels are (1,2,4,8,16,32) M⊙ pc-2. Top right: total gas surface density contours on the molecular gas fraction ΣH2/ΣHI. Greyscale levels are (1,2,4,8) × 0.1. Middle left: total gas surface density contours on the star formation timescale |
| Open with DEXTER | |
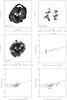 |
Fig. B.12
NGC 4548: top left: star formation rate (from UV+TIR) in contours on a greyscale map of the total gas surface density. Contour levels are (1,2,4,8,16) 3 × 10⁻⁴ M⊙ kpc-2 pc-1. Greyscale levels are (1,2,4,8,16) M⊙ pc-2. Top right: total gas surface density contours on the molecular gas fraction ΣH2/ΣHI. Greyscale levels are (1,2,4,8,16,32) × 0.1. Middle left: total gas surface density contours on the star formation timescale |
| Open with DEXTER | |
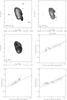 |
Fig. B.13
NGC 4569: top left: star formation rate (from UV+TIR) in contours on a greyscale map of the total gas surface density. Contour levels are (1,2,4,8,16,32,64) 8 × 10⁻⁴ M⊙ kpc-2 pc-1. Greyscale levels are (1,2,4,8,16,32,64) M⊙ pc-2. Top right: total gas surface density contours on the molecular gas fraction ΣH2/ΣHI. Greyscale levels are (1,2,4,8,16,32,64) × 0.1. Middle left: total gas surface density contours on the star formation timescale |
| Open with DEXTER | |
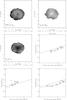 |
Fig. B.14
NGC 4579: top left: star formation rate (from UV+TIR) in contours on a greyscale map of the total gas surface density. Contour levels are (1,2,4,8,16) 3 × 10⁻⁴ M⊙ kpc-2 pc-1. Greyscale levels are (1,2,4,8,16) M⊙ pc-2. Top right: total gas surface density contours on the molecular gas fraction ΣH2/ΣHI. Greyscale levels are (1,2,4,8,16,32,64) × 0.1. Middle left: total gas surface density contours on the star formation timescale |
| Open with DEXTER | |
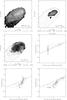 |
Fig. B.15
NGC 4654: top left: star formation rate (from UV+TIR) in contours on a greyscale map of the total gas surface density. Contour levels are (1,2,4,8,16,32,64,128) 3 × 10⁻⁴ M⊙ kpc-2 pc-1. Greyscale levels are (1,2,4,8,16,32,64) M⊙ pc-2. Top right: total gas surface density contours on the molecular gas fraction ΣH2/ΣHI. Greyscale levels are (1,2,4,8,16,32) × 0.1. Middle left: total gas surface density contours on the star formation timescale |
| Open with DEXTER | |
© ESO, 2012
Current usage metrics show cumulative count of Article Views (full-text article views including HTML views, PDF and ePub downloads, according to the available data) and Abstracts Views on Vision4Press platform.
Data correspond to usage on the plateform after 2015. The current usage metrics is available 48-96 hours after online publication and is updated daily on week days.
Initial download of the metrics may take a while.