Fig. B.1
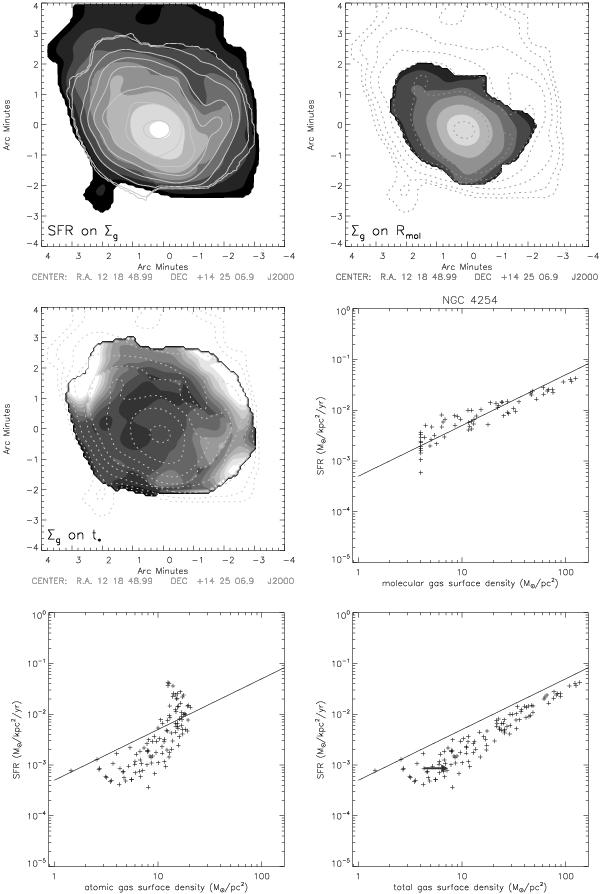
NGC 4254: top left: star formation rate (from UV+TIR) in contours on a greyscale map of the total gas surface density. Contour levels are (1,2,4,8,16,32,64,128) 3 × 10⁻⁴ M⊙ kpc-2 pc-1. Greyscale levels are (1,2,4,8,16,32,64,128) M⊙ pc-2. Top right: total gas surface density contours on the molecular gas fraction ΣH2/ΣHI. Greyscale levels are (1,2,4,8,16,32,64) × 0.1. Middle left: total gas surface density contours on the star formation timescale  . Greyscale levels are (1,10,20,30,40,50,60,70,80,90,100) 10 Myr. Middle right: star formation rate
  as a function of the molecular gas surface density ΣH2. The vertical set of points at the lowest Σmol are upper limits for Σmol. Lower left: star formation rate as a function of the atomic gas surface density ΣHI. Lower right: star formation rate as a function of the total gas surface density Σg = ΣH2 + ΣHI. The solid line corresponds to a star formation timescale of t∗ = 2 Gyr. The arrow takes into account the CO detection limit.
Current usage metrics show cumulative count of Article Views (full-text article views including HTML views, PDF and ePub downloads, according to the available data) and Abstracts Views on Vision4Press platform.
Data correspond to usage on the plateform after 2015. The current usage metrics is available 48-96 hours after online publication and is updated daily on week days.
Initial download of the metrics may take a while.