| Issue |
A&A
Volume 543, July 2012
|
|
|---|---|---|
| Article Number | A27 | |
| Number of page(s) | 31 | |
| Section | Interstellar and circumstellar matter | |
| DOI | https://doi.org/10.1051/0004-6361/201118347 | |
| Published online | 21 June 2012 | |
Online material
Appendix A: Identified lines
Observed transitions and line intensities.
Summary of recombination lines.
 |
Fig. A.1
Identified lines in the observation for an offset (0″, 0″). Blue labels are lines detected in the signal band, green labels are lines identified in the image band, and red labels are lines detected but not identified. |
| Open with DEXTER | |
 |
Fig. A.1
continued. |
| Open with DEXTER | |
 |
Fig. A.1
continued. |
| Open with DEXTER | |
 |
Fig. A.2
Identified lines in offset (+15″, −15″). Blue labels represent those lines detected in the signal band, green labels those lines identified in the image band, and red labels are lines detected but not identified. |
| Open with DEXTER | |
 |
Fig. A.2
continued. |
| Open with DEXTER | |
 |
Fig. A.2
continued. |
| Open with DEXTER | |
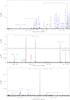 |
Fig. A.3
Identified lines in the observation for an offset (0″, 40″). Blue labels indicate lines detected in signal band, green labels those lines identified in the image band, and red labels are lines detected but not identified. |
| Open with DEXTER | |
 |
Fig. A.3
continued. |
| Open with DEXTER | |
 |
Fig. A.3
continued. |
| Open with DEXTER | |
Appendix B: Rotational diagrams
 |
Fig. B.1
Rotational diagrams of the IF’s most representative molecules (offset (0″, 0″)). |
| Open with DEXTER | |
 |
Fig. B.2
Rotational diagrams of the MP’s most representative molecules (offset ( + 15″, −15″)). |
| Open with DEXTER | |
 |
Fig. B.3
Rotational diagrams of the most representative molecules towards MP2 (offset (+0″, +40″)). |
| Open with DEXTER | |
 |
Fig. B.3
continued. |
| Open with DEXTER | |
© ESO, 2012
Current usage metrics show cumulative count of Article Views (full-text article views including HTML views, PDF and ePub downloads, according to the available data) and Abstracts Views on Vision4Press platform.
Data correspond to usage on the plateform after 2015. The current usage metrics is available 48-96 hours after online publication and is updated daily on week days.
Initial download of the metrics may take a while.