| Issue |
A&A
Volume 542, June 2012
|
|
|---|---|---|
| Article Number | A111 | |
| Number of page(s) | 36 | |
| Section | Interstellar and circumstellar matter | |
| DOI | https://doi.org/10.1051/0004-6361/201219124 | |
| Published online | 15 June 2012 | |
Online material
Appendix A: Individual molecular hydrogen emission-line objects
MHOs detected and identified in our survey.
Our analysis of the entire one-square-degree field (Fig. 1) has revealed more than 200 individual H2 1−0 S(1) emission line knots, bow shocks, and spikes which we group into 37 MHOs according to their positions and overall morphology. The MHO numbers from 900 to 936 were assigned according to the rising RA of each feature. In Table A.1 we list the names and coordinates of the detected MHOs in the first, second and third columns, respectively. Columns four and five list the observed and de-reddened fluxes for each MHO. Column six records the visual extinction (AV) obtained from the extinction map of the region presented in Fig. 5. Column seven and eight describe the morphology and list any Herbig-Haro (HH) objects associated with the 37 individual MHOs.
Appendix B: Multi-waveband data of the sources
The driving sources of the MHOs listed in Table A.1 are presented in Table B.1. Here we list the appropriate IDs from the 2MASS, AKARI/IRC, MSX6C, AKARI/FIS, IRAS and CSO 1.1 mm (Aspin et al. 2011) catalogues. Table B.2 lists the near to mid-infrared photometric magnitudes and colour indices for the same set of outflow sources (see also Figs. 9 and 10).
Multi-waveband source associations.
Near to mid-infrared photometry.
Appendix C: Individual outflow regions
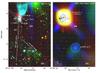 |
Fig. C.1
Colour-composite images of the area that includes IRAS 20568+5217, V2494 Cyg and numerous other related features. Contours show the CSO 1.1 mm data with values 40, 60, 80, 100, 140 and 180 mJy. The hashed numbers are the designated CSO cores from Aspin et al. (2011). The left panel is a composite of the optical [SII] (blue), Hα (green) and near-infrared H2 1 − 0 S(1) (red) line data, where the incomplete coverage in [SII] causes the vertical stripe artefact. The solid-line and dashed-line arrows show the propagation direction of the confirmed and questionable outflows, respectively. The dashed line ellipse in this case indicates the extent of the MHO 901 sub-knots. The right panel shows the same area constructed from IRAS HiRes 25 μm (blue), 60 μm (green) and 100 μm (red) bands, where the positions of known HH objects, MHOs and sources from the AKARI survey (Table B.1) are marked and explained in the legend. The dashed-line circles indicate the apparent extend of the sources discussed in the text. |
| Open with DEXTER | |
Appendix C.1: IRAS 20566+5217 (V2494 Cyg) region
Figure C.1 presents the immediate surroundings of IRAS 20568+5217 (HH 381 IRS), which was suggested as the driving source of several Herbig-Haro (HH) objects (Devine et al. 1997). IRAS 20568+5217 is also associated with a conical reflection nebula and has been shown to host an FU Ori type eruptive variable star (Aspin et al. 2009). This lead to the V2494 Cyg designation (Kazarovets et al. 2011). Our near-infrared colour − colour analysis (Fig. 9) confirms the very young stellar nature of V2494 Cyg.
An optical bipolar outflow (HH 965) has also been reported about 3 arcminutes to the southwest of V2494 Cyg (Magakian et al. 2010). An embedded star found midway between the bow shocks that comprise HH 965 has been proposed as the driving source; the IRAS HiRes-processed data reveals a 25 μm peak at the position of this source (Fig. C.1 right panel), which is referred to as Z20566+5213 in the IRAS faint source reject catalogue (Moshir et al. 2008). The near-infrared colours of this object (Fig. 9) are consistent with an embedded CTTS, perhaps even a low-mass pre-main-sequence (PMS) star. This would explain the non-detection of the source in the mid-infrared. We identify Z20566+5213 as the driving source of the HH 965 outflow.
There are several other HH knots and bow shocks observed in the close proximity of V2494 Cyg (Fig. C.1 left panel). While HH 381C belongs to the MHO 900 - 904 north-south bipolar outflow (Table 1), HH 381A and B are likely being driven by a source situated in the northeast (Magakian et al. 2010).
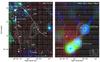 |
Fig. C.2
to Fig. C.1 but for the area that includes HH 380A (MHO 910A). |
| Open with DEXTER | |
Appendix C.2: HH 380A region
Figure C.2 shows the region around HH 380A and B, which were previously thought to belong to a single NE-SW outflow originating from V2494 Cyg (known at that time as HH 381 IRS) (Devine et al. 1997). Recently, however, Magakian et al. (2010) detected additional HH objects which support the existence of a number of outflows and therefore multiple driving sources (also theorised by Devine et al. 1997). Our near-infrared data reveal numerous additional outflow features which, in conjunction with our multi-waveband data analysis, leads to a clear picture of the situation in this figure.
IRAS 20573+5221 appears to be the driving source of a bipolar outflow evident as MHO 906 on one side and HH 968 on the other (Fig. C.2). The HH 968 lobe may extend as far as HH 381A and B (shown in Fig. C.1). IRAS 20573+5221 is identified as an embedded CTTS in our colour − colour analysis (Fig. 9); it also coincides with the CSO 1.1 mm core #47 (Aspin et al. 2011). This core is part of an extended dust continuum emission structure that connects with core #44. Both cores are only evident in far-infrared and millimetre wave data (Appendix B). Core #44 coincides with an extended IRAS 100 μm emission seen in the background (as red on Fig. C.2 right panel) and appears to be driving a 1.4 pc-long bipolar outflow comprising MHO 907, 909 and 910A. By contrast, the IRAS 25 and 60 μm emission peaks, labelled in Fig. C.2 as I20575+5218 and R20573+52196, are situated on the outskirts of core #44. This positional discrepancy is most likely the cause of the R20573+5219 source rejection. Careful inspection suggests that the source R20573+5219 may be connected with the yet unidentified 1.1 mm sub-core (not labeled) in #44 extended structure which can be clearly seen on the Fig. C.2.
The region also contains several outflow features which also deserve mentioning. HH 969 resembles a bow-shock which appears to be driven from a source associated with core #44 or one of the IRAS peaks (I20575+5218 or R20573+5219). MHO 905 (cf. Appendix D) is most likely the terminating bow of an outflow driven from the SW. Finally, MHO 910B and 910C are aligned with HH 968 and therefore may be associated with IRAS 20573+5221. This could be explained with a strong precession and/or possible existence of binary component and therefore would support the original assumption of NE-SW outflow by Devine et al. (1997).
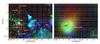 |
Fig. C.3
Similar to Fig. C.1 but for the area covering the CN4 and CN5. |
| Open with DEXTER | |
Appendix C.3: CN4 and CN5 region
Figure C.3 shows the area that includes the CN4 and CN5 cometary nebulae, as well as several HH objects discovered recently by Magakian et al. (2010). Both nebulae have been suggested as the driving sources of the HH objects. Their near-infrared colours suggest that they are mildly embedded CTTS objects (Fig. 9), although further spectroscopic study is needed further clarify their true nature. Based on the near-infrared H2 1 − 0 S(1) line observations and multicolour photometry presented in this paper, we are able to suggest an alternative scenario.
The area is host to a prominent IRAS source, IRAS 20575+5210 (Fig. C.3 right panel). IRAS 20575+5210 also coincides with the CSO 1.1 mm core #18 (Aspin et al. 2011), which encompasses both CN4 and CN5. Magakian et al. (2010) suggest that CN4 is the driving source of HH 974A and HH 974B, but the most likely candidate appears to be IRAS 20575+5210, which is only detected at far-infrared and millimetre wavelengths (Appendix B). In fact, this source appears to be driving a bipolar outflow consisting of MHO 903, 908 and HH 974 (Fig. C.3).
The same can be said about CN5 which was originally thought to be the driving source of HH 973 (Magakian et al. 2010). However, our analysis suggests that HH 973, together with HH 972 and HH 971, comprise yet another bipolar outflow (Fig. C.3, Table 5) that is driven by IRAS 20575+5210. It is likely that we are dealing with a multiple protostellar system embedded in a cold dust cloud identified as IRAS 20575+5210.
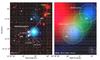 |
Fig. C.4
Similar to Fig. C.1 but for the area around MHO 911 (HH 627). |
| Open with DEXTER | |
Appendix C.4: MHO 911
Figure C.4 shows the region around MHO 911 and the optical knots that comprise HH 627, which were first detected by Movsessian et al. (2003). The overall bow-shock shape of MHO 911 suggests that it is driven by a source situated to the NW, where the CSO 1.1 mm core #51 is located (Aspin et al. 2011). Core #51 appears to be associated with the 60 μm IRAS emission feature R20581+5222; core #51 also peaks 10 − 20′′ to the SE of the cometary nebula CN6. CN6 was reported to host an embedded CTTS (Aspin et al. 2009); our colour − colour analysis confirms this interpretation (Fig. 9). We therefore identify CN6 as the driving source of MHO 911 (HH 627) (Magakian et al. 2010). CN6N is not thought to be associated with MHO 911, nor with R20581+5222: our colour analysis suggests that it is a background source, possibly an early-M type giant star (Fig. 9).
Identifying driving sources for the other shock features in Fig. C.4 is more difficult. IRAS R20582+5221 coincides with the 2MASS source 20594619+5233216, which has the colours of an embedded CTTS (it is labelled R20582+5221 on Fig. 9). This object could therefore be associated with some of the HH knots. Based on close inspection of the HH morphologies, we suggest that at least HH 627C and D are driven by R20582+5221. The position of HH 627B suggests that it could also be driven by R20582+5221, although CN6 is also a candidate if HH 627B and MHO 911 (HH 627A) are parts of the same shock front.
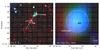 |
Fig. C.5
Similar to Fig. C.1 but for the MHO 913 outflow. |
| Open with DEXTER | |
Appendix C.5: MHO 913
Figure C.5 shows a new 0.2 pc-long bipolar outflow originating from IRAS 20583+5228, which coincides with the CSO 1.1 mm core #54. The NW lobe of this bipolar outflow has been detected in the optical and labelled HH 975 (Magakian et al. 2010), while the SW counter-lobe has only been observed in the near-infrared. Our colour − colour analysis confirms the YSO nature of IRAS 20583+5228 (Fig. 9), which is clearly the driving source of this outflow.
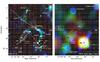 |
Fig. C.6
Similar to Fig. C.1 but for the area around the V2495 Cyg (Braid Nebula). |
| Open with DEXTER | |
Appendix C.6: Braid (V2495 Cyg) region
The centre of our survey field (cf. Fig. 1) has been studied previously by Movsessian et al. (2003), although incomplete coverage in H2 1−0 S(1) emission limited their ability to identify outflows and their driving sources. Here, with the aid of wider-field near-IR observations and archival photometric data, we are more successful in understanding the situation.
Figure C.6 shows the immediate vicinity of the Braid Nebula overlaid with CSO 1.1 mm emission contours (Aspin et al. 2011). The 1.1 mm data clearly outline the densest regions (the cores) which most likely host the driving sources of the numerous outflows detected.
The Braid Nebula star, which coincides with core #39 and a faint IRAS HiRes source, is identified as an FU Ori type outburst star (Movsessian et al. 2006). It has recently received the designation V2495 Cyg (Kazarovets et al. 2011). V2495 Cyg drives a bipolar outflow that is traced by HH 635 in the NE and HH 629 in the SW. The apparent asymmetry of the bipolar outflow is most likely caused by the presence of dense, cold dust to the NE (Fig. C.6).
As can be seen from Fig. C.6, one of the most prominent sources in the region is IRAS 20588+5215 (IRAS 15), which coincides with the CSO 1.1 mm core #30. Since the IRAS emission associated with this source is quite extended, it encompasses several sources which we will discuss separately for the sake of clarity. Optical and near-infrared observation reveal two stars (IRAS 15N and IRAS 15S) in the vicinity of the IRAS error ellipse. IRAS 15N was spectroscopically studied by Aspin et al. (2009) who concluded that it is a highly active accreting CTTS with a significant K-band thermal excess. Our analysis suggest that IRAS 15N is driving at least one bipolar outflow spanning from MHO 914 to 923 (HH 448, RNO 127). IRAS 15N might be responsible for two other bipolar outflows, traced by MHO 920 to HH 631 and by MHO 921 to 919, as shown in Fig. C.6. IRAS 15S, by contrast, was found to be a foreground object. A near-IR spectrum obtained toward IRAS 15S does contain H2 emission (Aspin et al. 2009); we suggest that this could be caused by the superimposition of outflow features emanated from IRAS 15N.
The CN2 and CN8 cometary nebulae are situated within the extent of IRAS 15 (cf. Fig. C.6). Our colour − colour analysis indicates that both are CTTSs (Fig. 9). Magakian et al. (2010) suggest that CN2 drives the outflow traced by MHO 917 and HH 630. This seems likely given the positional placement of the detected outflow features. There is no mid-infrared emission detected towards CN2, though this could be due to the AKARI/IRC detection limits (50 mJy ~ 7.6 mag at 9 μm). Near-IR spectroscopic data presented by Aspin et al. (2009) suggests that at one stage CN8 drew wide-angle molecular outflow (Magakian et al. 2010) suggesting a different scenario for the MHO 919 origin.
The area presented in Fig. C.6 is also host to a prominent optical and near-infrared flow, MHO 926 (HH 634). MHO 926 consists of a chain of well-defined bows connecting with MHO 923A and B (Movsessian et al. 2003). It seems clear that the bipolar outflow MHO 926 to 923A,B is being powered by a source associated with the 1.1 mm core #33. This driving source is detected in the AKARI/IRC and AKARI/FIS catalogues (Appendix B). Moreover, the near-IR colours of this object (J − H = 6.09 and H − K = 5.95; not shown on Fig. 9) indicate that it is deeply embedded. It is interesting to note that the MHO 923/926 outflow appears to terminate in the outskirts of the core that hosts V2495 Cyg (core #39). This could simply be due to increased extinction as the flow drills into or passes behind core #39.
There are several other monopolar flows in the area which deserve mentioned. IRAS 20591+5214 (IRAS 14) drives a short flow represented by MHO 925 (HH 633) (Movsessian et al. 2003). The source itself has the typical colours of a Class II YSO or possibly a Class I protostar.
IRAS 20590+5221 or the associated cometary nebula CN1 was classified as an accreting CTTS star (Aspin et al. 2009) which drives HH 632 (Magakian et al. 2010). Unfortunately we did not detect any near-infrared H2 1 − 0 S(1) line features associated with this outflow, although our colour analysis does confirm the YSO nature of CN1 (Fig. 9).
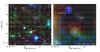 |
Fig. C.7
Similar to Fig. C.1 but for the Cyg 19 region. |
| Open with DEXTER | |
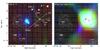 |
Fig. C.8
Similar to Fig. C.1 but for the IRAS 21005+5217 region. |
| Open with DEXTER | |
Finally, the monopolar flow, HH 628, is driven by an embedded CTTS object, CN3N (IRAS 20585+5222).
Appendix C.7: Cyg 19 region
Figure C.7 shows the area around Cyg 19, an Hα star first reported by Melikian & Karapetian (1996). Our near-infrared H2 line survey revealed a 2.3 pc-long (Table 1) bipolar outflow comprising MHO 912, 915 and 922. Each MHO represents a chain of bows and arcs. Cyg 19 is situated on the axis that defines the lobe and counter-lobe of this bipolar outflow. It could be the driving source of this flow, although its near-infrared colours and spectroscopy (Aspin et al. 2009) suggest that it is a mildly embedded dwarf star. The presence of curving nebulosity around Cyg 19 indicates an outflow cavity seen close to pole-on that is illuminated by scattered light. This nebulosity, together with the detection of Hα emission (Melikian & Karapetian 1996), indicates that Cyg 19 could be a sporadically accreting YSO (Aspin et al. 2009). Although the CSO 1.1 mm core #7 does not coincide exactly with Cyg 19, there is faint extended IRAS emission towards this source. The former could be due to the positional uncertainty of the CSO 1.1 mm data (Aspin et al. 2011), or the 1.1 mm data could indicate the true location of the MHO 912/915/922 bipolar outflow driving source.
About 4 arcmin north we identify a faint H2 feature, MHO 918 (Fig. C.7), which could be driven from either CSO 1.1 mm core #14 or core #20 (Aspin et al. 2011). Core #20 is perhaps the most likely source, since it coincides with IRAS 20588+5221. There is also a star in the centre of core #20 detected in the near- and mid-infrared with colours typical of a heavily embedded protostar (possibly a Class I source; Fig. 9).
Appendix C.8: IRAS 21005+5217 region
Figure C.8 illustrates the area containing MHO 928, 929, 930, 933 and 936. Our analysis suggest that there are two bipolar, almost perpendicular outflows emanating from IRAS 21005+5217. One spans from MHO 930 to 935 while the other includes MHO 933 and 928. It is possible that the NW side of the second flow also contains MHO 929 if this outflow is precessing (Table 1). Our near-infrared colour − colour analysis (Fig. 9) suggests that IRAS 21005+5217 is an embedded CTTS or possibly a younger object. This source is prominent in the IRAS HiRes 100 μm data (Fig. C.8). However, there is no CSO 1.1 mm core associated with IRAS 21005+5217 (within the 3σ detection limit Aspin et al. 2011). This may be explained by an absence of dust and gas, due to the presence of a high energy intermediate or high mass source.
There are two other 1.1 mm cores in Fig. C.8, which could be the driving sources of MHO 936. The location and the overall morphology of MHO 936 suggests that it has been driven from core #26.
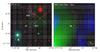 |
Fig. C.9
Similar to Fig. C.1 but for the area around MHO 932 and 931. |
| Open with DEXTER | |
Appendix C.9: MHO 931 and 932
Figure C.9 shows the region where MHO 931 and 932 are located. The morphology of these objects suggests different outflow directions as indicated by the arrows. MHO 931 might originate from a source to the northwest, while MHO 932 might be driven from the southwest. The bright star 2MASS 21015977+5220127 evident in this figure has no apparent morphological feature which might suggest that it is the driving source of the objects. Moreover, our colour − colour analysis suggests that it is a background source (Fig. 9). The presence of these two MHOs – 931 and 932 – in close proximity could be explained by their encounter with the dense environment associated with CSO 1.1 mm core #9.
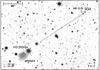 |
Fig. C.10
Near-infrared H2 1−0 S(1)+Continuum view of the area around MHO 934. Dashed-line arrow shows the suspected direction of the flow. |
| Open with DEXTER | |
Appendix C.10: MHO 934
MHO 934 (Fig. C.10) is situated in an area of our surveyed field where we lack complete coverage in all optical bands (Fig. 1). Never-the-less, it is associated with HH 978 (Magakian et al. 2010). The overall morphology of this bow shock suggests a driving source to the SE, where HD 200594 is located. However, the near-infrared colours of this source indicate that it is a main sequence star (Fig. 9). It is therefore unlikely to be the driving source of the MHO 934 bow shock.
Appendix D: Details of the detected MHOs
© ESO, 2012
Current usage metrics show cumulative count of Article Views (full-text article views including HTML views, PDF and ePub downloads, according to the available data) and Abstracts Views on Vision4Press platform.
Data correspond to usage on the plateform after 2015. The current usage metrics is available 48-96 hours after online publication and is updated daily on week days.
Initial download of the metrics may take a while.