Fig. C.1
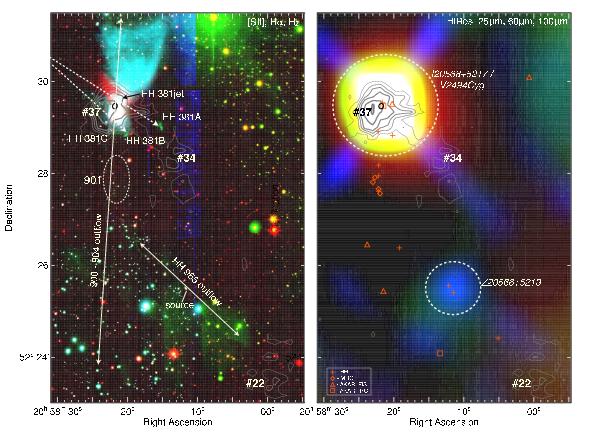
Colour-composite images of the area that includes IRAS 20568+5217, V2494 Cyg and numerous other related features. Contours show the CSO 1.1 mm data with values 40, 60, 80, 100, 140 and 180 mJy. The hashed numbers are the designated CSO cores from Aspin et al. (2011). The left panel is a composite of the optical [SII] (blue), Hα (green) and near-infrared H2 1 − 0 S(1) (red) line data, where the incomplete coverage in [SII] causes the vertical stripe artefact. The solid-line and dashed-line arrows show the propagation direction of the confirmed and questionable outflows, respectively. The dashed line ellipse in this case indicates the extent of the MHO 901 sub-knots. The right panel shows the same area constructed from IRAS HiRes 25 μm (blue), 60 μm (green) and 100 μm (red) bands, where the positions of known HH objects, MHOs and sources from the AKARI survey (Table B.1) are marked and explained in the legend. The dashed-line circles indicate the apparent extend of the sources discussed in the text.
Current usage metrics show cumulative count of Article Views (full-text article views including HTML views, PDF and ePub downloads, according to the available data) and Abstracts Views on Vision4Press platform.
Data correspond to usage on the plateform after 2015. The current usage metrics is available 48-96 hours after online publication and is updated daily on week days.
Initial download of the metrics may take a while.