| Issue |
A&A
Volume 540, April 2012
|
|
|---|---|---|
| Article Number | L5 | |
| Number of page(s) | 7 | |
| Section | Letters | |
| DOI | https://doi.org/10.1051/0004-6361/201118545 | |
| Published online | 28 March 2012 | |
Online material
Appendix A: Arp 299-A and Arp 220
 |
Fig. A.1
Surface density profile of the 30 inner SNe in Arp 299-A. The solid green line is
a non-linear fit to an exponential disk with
|
| Open with DEXTER | |


 |
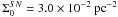
Fig. A.2
Surface density of SNe vs radii normalized to the furthest source, rout, in Arp 299-A and non-linear fit to a power law with γ = 1.1. |
| Open with DEXTER | |
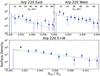 |
Fig. A.3
Non-linear fits to the surface density profile of the radial distribution of SNe
in Arp 220. Top left: fit to the 19 inner sources in the eastern
nucleus ( |
| Open with DEXTER | |


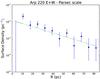 |
Fig. A.4
Surface density profile of the combined sources for the east and west nuclei of
Arp 220, in parsecs. The non-linear fit yields a scale length of
hSN = 23.4 pc, with
|
| Open with DEXTER | |
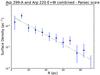 |
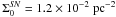
Fig. A.5
Surface density profile of the combined sources for Arp 299-A and Arp 220, in
parsecs. The non-linear fit yields a scale-length of
hSN = 19.4 pc and
|
| Open with DEXTER | |
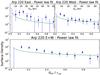 |
Fig. A.6
Non-linear power-law fits of the surface density of SNe vs. radius, normalized to the furthest source, rout, in Arp 220. Top left: east nucleus, with γ = 1.0. Top right: west nucleus, with γ = 0.7. Bottom: combined analysis for the east and west nuclei (48 sources), yielding γ = 0.7. Note that some of the points are in rings where no sources were detected. While their corresponding surface density is zero, their upper limits were used in the fit. |
| Open with DEXTER | |
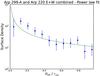 |
Fig. A.7
Surface density of SNe vs radii normalized to the furthest source, rout, for the combined sample of SNe from Arp 299-A and the two nuclei of Arp 220. A non-linear fit to a power law with radius yields γ = 0.9. |
| Open with DEXTER | |
Appendix B: M 82
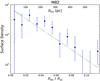 |
Fig. B.1
Surface density profile for the radial distribution of SNe in M 82 (39 objects).
The solid green line is a non-linear fit to an exponential disk with
|
| Open with DEXTER | |


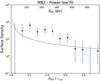 |
Fig. B.2
Surface density of SNe vs. radii normalized to the furthest source, rout and non-linear fit to a power law (nuclear) disk for M 82. The poor goodness of the fit does not seem to be consistent with a nuclear disk whose SN surface density follows a power law in the central few hundred pc. |
| Open with DEXTER | |
Appendix C: Nature of the radio sources
The sources used in this paper are classified generically as supernovae (SNe), by which we mean core collapse supernovae (CCSNe) and SNRs. In the case of M 82, the closest of the three galaxies discussed here, we used the source list in McDonald et al. (2002) and Fenech et al. (2008), where the authors already discriminate SNe from HII regions based on their spectral shape, brightness temperature, and observed shell structure. In the cases of the more distant galaxies, Arp 299 and Arp 220, we used available spectral information from the literature, and especially, the brightness temperatures inferred from VLBI observations, which for all of the sources correspond to non-thermal radio emitters (e.g., Pérez-Torres et al. 2009, for Arp 299A; Parra et al. 2007, for Arp 220).
Single or multiple ultra compact HII (UC HII) regions can be ruled out because their ionizing radiation is normally dominated by a single O star, whose maximum free-free thermal radio luminosity is several orders of magnitude below the radio luminosity from any of the objects detected in either Arp 299-A or Arp 220. The expected thermal radio emission from super star clusters (SSCs), which can host up to a few 105 stars, similarly cannot be responsible for the observed emission. At the distances of Arp 299 and Arp 220, the VLBI beam sizes correspond to ~1.5 pc, implying radial sizes of at most about 0.8 pc. Young massive stellar clusters of this size have a mass of at most 5 × 10⁵ M⊙ (e.g. Portegies Zwart et al. 2010). Assuming a Kroupa initial mass function with α = −1.0 between 0.1 and 0.5 M⊙, and α = −2.35 between 0.5 and 100 M⊙, the number of O6 and earlier type stars is 142 (out of a total of 105 stars), hence the maximum attainable thermal radio luminosity would be ~2 × 1025 erg/s/Hz, which is at least an order of magnitude lower than observed in Arp 299-A or Arp 220.
© ESO, 2012
Current usage metrics show cumulative count of Article Views (full-text article views including HTML views, PDF and ePub downloads, according to the available data) and Abstracts Views on Vision4Press platform.
Data correspond to usage on the plateform after 2015. The current usage metrics is available 48-96 hours after online publication and is updated daily on week days.
Initial download of the metrics may take a while.