| Issue |
A&A
Volume 539, March 2012
|
|
|---|---|---|
| Article Number | A103 | |
| Number of page(s) | 18 | |
| Section | Extragalactic astronomy | |
| DOI | https://doi.org/10.1051/0004-6361/201118378 | |
| Published online | 01 March 2012 | |
Online material
Appendix A: Tests of the method
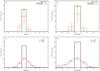 |
Fig. A.1
Upper row: a) synthetic SFH and b) CEH of a single burst of star formation without adding any photometric errors. The input SFH is the solid black histogram, while the recovered SFH is the green histogram when using the same parameter gridding as the input. The red histogram gives the solution when using a set of different parameter griddings. Bottom row: a burst of star formation with realistic errors from artificial star tests. The black histogram in c) the SFH and d) the ceh is the input SFH and the red histograms indicate the recovered SFH using a set of different population gridding schemes. A Gaussian fit to the recovered SFH is shown as a black line, with the mean (μ) and variance (σ) also listed. |
| Open with DEXTER | |
In order to test the ability of Talos to accurately recover a SFH, a number of tests were made on CMDs for which the properties are known, as well as on observed data for a well studied globular cluster.
A.1. Synthetic tests
First of all, a number of simple artificial stellar populations were generated. By recovering the SFH of these populations it is possible to test how accurate our method can recover an input SFH.
We determine the ability of Talos to recover the age, metallicity and SFR in a series of synthetic episodes of star formation. The stellar population was generated assuming the distance modulus and reddening of Sculptor, and using the artificial star tests to obtain realistic photometric uncertainties. In this way realistic colour magnitude diagrams can be obtained, of the same quality as the observed CMD of the Sculptor dSph.
As a first check, we apply the SFH fitting method to a single synthetic episode of star formation. The Dartmouth isochrones are used to generate a synthetic CMD with a continuous star formation between 9 and 10 Gyr and −1.9 < [Fe/H] < −1.7 dex. First, the episode was generated without any photometric errors and the SFH determined using the exact parameter gridding of [Fe/H] and age as used to generate the population (green histogram). The SFH is also determined using a set of different parameter griddings (red histogram, see Figs. A.1a,b) in order to test the effect of using different griddings to obtain the uncertainties on the SFH (see Sect. 3.3.1).
Given exactly the same parameter gridding as the input population, the SFH is recovered at the right age and metallicity with the correct strength. A limited amount of “bleeding” is observed, due to the uncertainties induced by the quality of the data. The effect of using a set of different griddings is more substantial bleeding of the star formation rate into neighbouring bins in age and metallicity (as seen in the red histograms in Figs. A.1a, b). This bleeding is a direct consequence of the quality of the photometric data and the use of different parameter griddings, and determines the SFH resolution (see Sect. 3.3.1). Since we do not have a priori knowledge of the duration and metallicity of an episode of star formation in the observed data, the choice of adopting a single population gridding will lead to biases in the results. Therefore, we always consider a range of different parameter griddings in obtaining the final SFH.
 |
Fig. A.2
a) SFH and b) CEH of a continuous episode of star formation including realistic errors. The black line indicates the input values and the red histogram the recovered values. |
| Open with DEXTER | |
When including realistic photometric errors determined from artificial star tests for the model of an episode of star formation, the same bleeding effect is seen. The parameters of the recovered SFH are determined by fitting a Gaussian profile, see Figs. A.1c, d. The peaks of the SFH and CEH are recovered well within the input values ([Fe/H]mean = −1.84 dex, Agemean = 9.64 Gyr), but the star formation is distributed over more bins, spreading out the star formation episode in time. Figure A.1 shows that ≈40% of the total star
formation is typically recovered within the central peak. Due to the quality of the observed photometric data (which only just detects the oldest MSTOs) there remains some degeneracy between the burst strength and duration, which could be removed by obtaining deeper CMDs that resolve the MSTO with more accuracy.
Next we consider a more realistic synthetic population which has experienced constant star formation (SFR = 10-4 M⊙/yr) over the metallicity range −2.5 < [Fe/H] < −1.1 dex between 6 and 15 Gyr ago. To take into account the effect of constraints from spectroscopic observations, the solution was determined taking into account a synthetic MDF which samples 50% of the RGB stars. The results are given in Fig. A.2. It can be seen that the input values are correctly recovered for a synthetic population with constant star formation, within the SFH uncertainties.
A.2. Globular cluster NGC 1904
The final test we carry out is to apply our method to real observations of a globular cluster, which is, within our errors, a simple stellar population. During our observing run Galactic globular cluster NGC 1904 was also observed in the B,V and I filters. For NGC 1904 there have been several photometric and spectroscopic studies (see Table A.1), making it a good test of our method. The reduction of these observations, as well as the artificial star tests were done in exactly the same way as for Sculptor.
Adopted properties of NGC 1904.
To obtain the SFH for NGC1904, [α/Fe] was chosen as a fixed value constrained by spectroscopic observations (see Table A.1), while the age and metallicity were left as free parameters. The best solution, using only the available photometric data is given in Fig. A.3. The SFH and CEH show bleeding into neighbouring bins, due to measurement errors and the use of different parameter griddings used. This is similar to the bleeding effect seen in Fig. A.1. The SFH clearly indicates a very old population, in good agreement with typical globular ages. A Gaussian fit to the metallicity distribution gives a mean value (μ) at [Fe/H] = −1.58 dex, with a variance of σ = 0.17 dex. This is in good agreement with the spectroscopic [Fe/H] given in Table A.1. This shows that Talos is able to recover the age and metallicity of a real data set with all the errors and uncertainties that it implies.
These experiments show the capability of Talos to recover the age and metallicity of a stellar population, as well as the limit of our ability to unambiguously distinguish a burst of star formation from a more continuous SFR over a longer time.
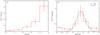 |
Fig. A.3
a) The SFH and b) CEH obtained for NGC 1904 from photometric information in the B,V and I filters. A Gaussian fit to the MDF is also shown as a black, dotted line, with parameters given in the plot. |
| Open with DEXTER | |
© ESO, 2012
Current usage metrics show cumulative count of Article Views (full-text article views including HTML views, PDF and ePub downloads, according to the available data) and Abstracts Views on Vision4Press platform.
Data correspond to usage on the plateform after 2015. The current usage metrics is available 48-96 hours after online publication and is updated daily on week days.
Initial download of the metrics may take a while.