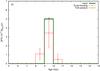
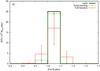
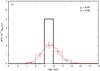
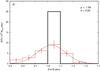
Fig. A.1
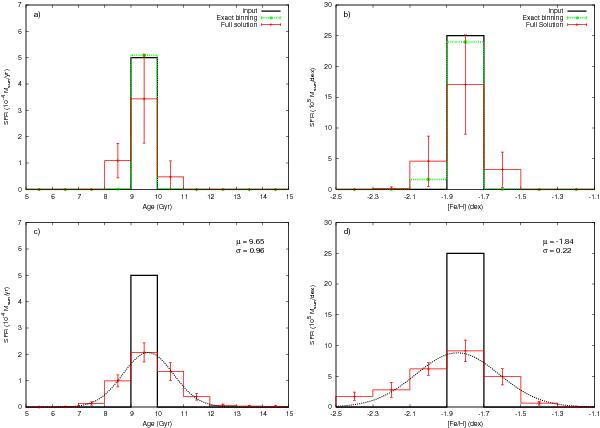
Upper row: a) synthetic SFH and b) CEH of a single burst of star formation without adding any photometric errors. The input SFH is the solid black histogram, while the recovered SFH is the green histogram when using the same parameter gridding as the input. The red histogram gives the solution when using a set of different parameter griddings. Bottom row: a burst of star formation with realistic errors from artificial star tests. The black histogram in c) the SFH and d) the ceh is the input SFH and the red histograms indicate the recovered SFH using a set of different population gridding schemes. A Gaussian fit to the recovered SFH is shown as a black line, with the mean (μ) and variance (σ) also listed.
Current usage metrics show cumulative count of Article Views (full-text article views including HTML views, PDF and ePub downloads, according to the available data) and Abstracts Views on Vision4Press platform.
Data correspond to usage on the plateform after 2015. The current usage metrics is available 48-96 hours after online publication and is updated daily on week days.
Initial download of the metrics may take a while.