| Issue |
A&A
Volume 538, February 2012
|
|
|---|---|---|
| Article Number | A142 | |
| Number of page(s) | 21 | |
| Section | Interstellar and circumstellar matter | |
| DOI | https://doi.org/10.1051/0004-6361/201117299 | |
| Published online | 16 February 2012 | |
Online material
Appendix A: Presentation of the data
Tables presenting the data are given in this section.
Stars with U, B, and V magnitudes.
Catalogue of stars: R magnitudes.
Appendix B: The results
We present the results of the fits and all the two-color diagrams for zones 1 to 8. Table B.1 gives the slope of the linear regression for the different filters in the 8 zones. The normal slope is given in the last row. For a few zones and a few wavelengths, it is impossible to determine any reliable slope because of the too small number of data points. Table B.2 gives the correlation coefficient of the fit. Table B.3 gives the RV values deduced from Eq. (1). The last column gives the RV weighted mean value. The small thick segment at the bottom left of the plots is the locus of the unreddened O-B3 stars (from Martins et al. 2006; Koornneef et al. 1983; and Wegner 1994).
Fitted slopes.
Correlation coefficient of the fitted lines.
RV determination.
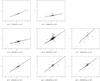 |
Fig. B.1
Zone 1 two color diagrams. |
| Open with DEXTER | |
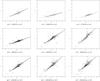 |
Fig. B.2
Zone 2 two color diagrams. |
| Open with DEXTER | |
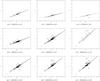 |
Fig. B.3
Zone 3 two color diagrams. |
| Open with DEXTER | |
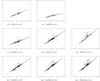 |
Fig. B.4
Zone 4 two color diagrams. |
| Open with DEXTER | |
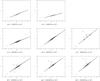 |
Fig. B.5
Zone 5 two color diagrams. |
| Open with DEXTER | |
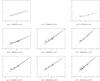 |
Fig. B.6
Zone 6 two color diagrams. |
| Open with DEXTER | |
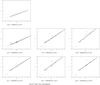 |
Fig. B.7
Zone 7 two color diagrams. |
| Open with DEXTER | |
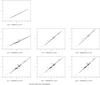 |
Fig. B.8
Zone 8 two color diagrams. |
| Open with DEXTER | |
© ESO, 2012
Current usage metrics show cumulative count of Article Views (full-text article views including HTML views, PDF and ePub downloads, according to the available data) and Abstracts Views on Vision4Press platform.
Data correspond to usage on the plateform after 2015. The current usage metrics is available 48-96 hours after online publication and is updated daily on week days.
Initial download of the metrics may take a while.