| Issue |
A&A
Volume 535, November 2011
|
|
|---|---|---|
| Article Number | A24 | |
| Number of page(s) | 32 | |
| Section | Catalogs and data | |
| DOI | https://doi.org/10.1051/0004-6361/201015772 | |
| Published online | 26 October 2011 | |
Online material
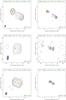 |
Fig. 1
Dual-frequency simultaneous 2 and 8 GHz CLEAN images. The lowest contour value “clev” is chosen at four times the rms level, and the peak brightness is given by “max” (Jy/beam). The contour levels increase by factors of two. The dashed contours indicate negative flux. The beam is shown in the bottom left corner of the images at the half-power level. An epoch of observation is shown in the bottom right corner. Blue and orange spots indicate Gaussian model components 1 and 2, respectively. The brightness distribution is shown at the full resolution of naturally weighted data, while the model components are fitted in a restricted uv-range that is common to both bands, see Sect. 4 for details. |
| Open with DEXTER | |
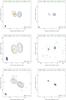 |
Fig. 1
continued. |
| Open with DEXTER | |
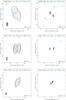 |
Fig. 1
continued. |
| Open with DEXTER | |
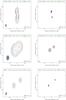 |
Fig. 1
continued. |
| Open with DEXTER | |
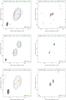 |
Fig. 1
continued. |
| Open with DEXTER | |
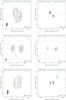 |
Fig. 1
continued. |
| Open with DEXTER | |
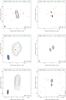 |
Fig. 1
continued. |
| Open with DEXTER | |
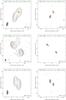 |
Fig. 1
continued. |
| Open with DEXTER | |
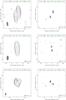 |
Fig. 1
continued. |
| Open with DEXTER | |
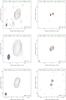 |
Fig. 1
continued. |
| Open with DEXTER | |
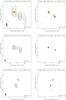 |
Fig. 1
continued. |
| Open with DEXTER | |
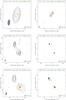 |
Fig. 1
continued. |
| Open with DEXTER | |
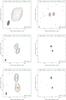 |
Fig. 1
continued. |
| Open with DEXTER | |
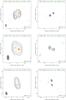 |
Fig. 1
continued. |
| Open with DEXTER | |
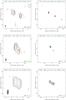 |
Fig. 1
continued. |
| Open with DEXTER | |
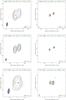 |
Fig. 1
continued. |
| Open with DEXTER | |
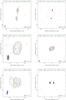 |
Fig. 1
continued. |
| Open with DEXTER | |
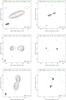 |
Fig. 1
continued. |
| Open with DEXTER | |
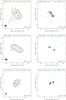 |
Fig. 1
continued. |
| Open with DEXTER | |
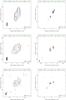 |
Fig. 1
continued. |
| Open with DEXTER | |
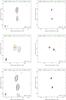 |
Fig. 1
continued. |
| Open with DEXTER | |
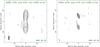 |
Fig. 1
continued. |
| Open with DEXTER | |
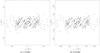 |
Fig. 5
uv-coverage obtained for the CSO candidate source J1357 + 4353 at 2.3 GHz a) and 8.6 GHz b) observed on 2002 May 14 within the VCS2 (Fomalont et al. 2003) VLBA experiment. |
| Open with DEXTER | |
List of CSO candidates selected from VCS and RDV surveys.
© ESO, 2011
Current usage metrics show cumulative count of Article Views (full-text article views including HTML views, PDF and ePub downloads, according to the available data) and Abstracts Views on Vision4Press platform.
Data correspond to usage on the plateform after 2015. The current usage metrics is available 48-96 hours after online publication and is updated daily on week days.
Initial download of the metrics may take a while.