| Issue |
A&A
Volume 534, October 2011
|
|
|---|---|---|
| Article Number | A18 | |
| Number of page(s) | 10 | |
| Section | Stellar structure and evolution | |
| DOI | https://doi.org/10.1051/0004-6361/201116999 | |
| Published online | 22 September 2011 | |
Online material
Appendix A: Properties of models
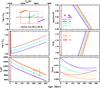 |
Fig. A.1
An HR diagram and the time evolution of Teff, L, log g, R, and Zsurf are shown. Observationally determined ± 1σ intervals are shown for L, Teff, g, and R. For Teff, the spectroscopically determined error bar is in black, while that determined using luminosity and radius is in red (see the text). Each model is color coded and identified in the figure. The adopted acceptable age range is from 200 to 250 Myr (see the text). In the HR diagram, only the part of the curves between 200 and 250 Myr is shown; see Fig. 1 for a more complete figure. All models were calculated with turbulence. |
| Open with DEXTER | |
Appendix B: Radiative accelerations and interior concentrations for all species
 |
Fig. B.1
Radiative accelerations after 232 Myr evolution in a model with mass loss of 10-13 M⊙/yr (red curves) and in a model with turbulence with ΔM0 = 1.4 × 10⁻⁶ M⊙ (blue curves) for all calculated atomic species. The sharp mimima in the grad(Ti), grad(Cr), and grad(Mn) curves at log ΔM/M∗ ~ − 10 appear surprising but have been verified to be a systematic property of the OPAL atomic data. |
| Open with DEXTER | |
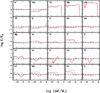 |
Fig. B.2
Mass fractions in the models with turbulence (blue curves) and mass loss (red curves). See the caption of Fig. B.1. |
| Open with DEXTER | |
© ESO, 2011
Current usage metrics show cumulative count of Article Views (full-text article views including HTML views, PDF and ePub downloads, according to the available data) and Abstracts Views on Vision4Press platform.
Data correspond to usage on the plateform after 2015. The current usage metrics is available 48-96 hours after online publication and is updated daily on week days.
Initial download of the metrics may take a while.