| Issue |
A&A
Volume 532, August 2011
|
|
|---|---|---|
| Article Number | A2 | |
| Number of page(s) | 14 | |
| Section | Stellar atmospheres | |
| DOI | https://doi.org/10.1051/0004-6361/201116478 | |
| Published online | 11 July 2011 | |
Online material
Appendix A: An example of a global fit: HD 35299
To illustrate the global quality achieved in the spectral synthesis when a final self-consistent solution is considered, we show in Figs. A.1−A.5 the observed spectrum of an example star HD 35299 and a synthetic spectrum computed using the stellar parameters and abundances indicated in Table 3. The spectral analysis was based on all Balmer and He lines and the metal lines marked at the bottom of the panels. For completeness purposes, all available lines from our present model atoms – even the lines excluded from the analysis for different reasons mentioned in Sect. 4 – and also from other atoms not analysed here in NLTE are included.
Surface gravities were determined from the wings of the Balmer lines and multiple metal ionization equilibria, which
might be even more sensitive to this parameter. The cores of the hydrogen lines – which cannot always be closely fitted – do not affect the analysis performed in this work, or at least, the effect is negligible.
The line identification is based on the lines included in our input for Surface. Evidently, still some remaining lines/elements need to be included to achieve complete coverage by the global spectrum synthesis. The dentifications of the missing lines in the most important blue spectral region may be achieved on the basis of the spectral atlases of Kilian et al. (1991).
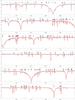 |
Fig. A.1
Comparison between the observed (black) and the model spectrum (red line) for the star HD 35299, for parameters and elemental abundances as given in Table 3. The spectral analysis was based on all Balmer and He lines and the metal lines marked at the bottom of the panels. Additional lines have been included in the global spectrum for visualization purposes, but the linelist is not complete. See the text for details. |
| Open with DEXTER | |
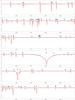 |
Fig. A.2
Same as Fig. A.1. |
| Open with DEXTER | |
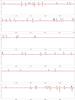 |
Fig. A.3
Same as Fig. A.1. |
| Open with DEXTER | |
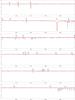 |
Fig. A.4
Same as Fig. A.1. |
| Open with DEXTER | |
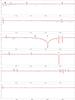 |
Fig. A.5
Same as Fig. A.1. |
| Open with DEXTER | |
© ESO, 2011
Current usage metrics show cumulative count of Article Views (full-text article views including HTML views, PDF and ePub downloads, according to the available data) and Abstracts Views on Vision4Press platform.
Data correspond to usage on the plateform after 2015. The current usage metrics is available 48-96 hours after online publication and is updated daily on week days.
Initial download of the metrics may take a while.