Fig. A.1
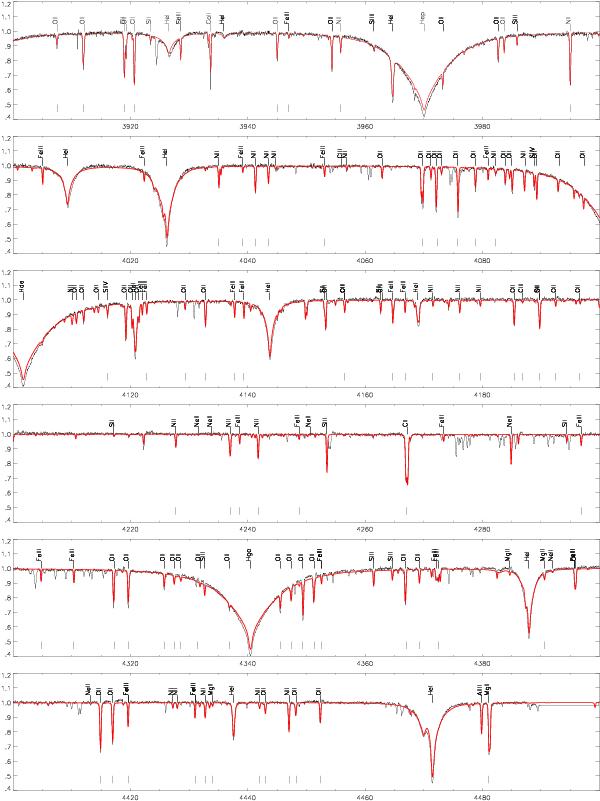
Comparison between the observed (black) and the model spectrum (red line) for the star HD 35299, for parameters and elemental abundances as given in Table 3. The spectral analysis was based on all Balmer and He lines and the metal lines marked at the bottom of the panels. Additional lines have been included in the global spectrum for visualization purposes, but the linelist is not complete. See the text for details.
Current usage metrics show cumulative count of Article Views (full-text article views including HTML views, PDF and ePub downloads, according to the available data) and Abstracts Views on Vision4Press platform.
Data correspond to usage on the plateform after 2015. The current usage metrics is available 48-96 hours after online publication and is updated daily on week days.
Initial download of the metrics may take a while.