| Issue |
A&A
Volume 532, August 2011
|
|
|---|---|---|
| Article Number | A57 | |
| Number of page(s) | 26 | |
| Section | Cosmology (including clusters of galaxies) | |
| DOI | https://doi.org/10.1051/0004-6361/201016348 | |
| Published online | 22 July 2011 | |
Online material
Appendix A: Redshifts
NTT/EMMI spectroscopic redshifts of SCL2243-G and I (left), SCL2243-H (middle) and SCL2243-J (right).
Appendix B: Further plots
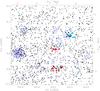 |
Fig. B.1
Same as Fig. 6, but for late-type galaxies with 0.40 ≤ zphot ≤ 0.52. Note that the filamentary supercluster structure is much less evident from these galaxies. Overlaid are galaxies with EMMI and SDSS spectra within 0.43 < zspec < 0.46 (red dots). Blue dots with black circles have 0.32 < zspec < 0.33. The cluster at RA = 340.2 Dec = −9.35 is a foreground object (z = 0.326) superimposed over a sub-structure at z = 0.456. The solid blue contours represent the S/N of the mass reconstruction, starting at 2σ and increasing in steps of 1.0σ; dashed contours represent negative values (2σ and 3σ). The smoothing length for the surface mass density was 4.′0. The upper and right axes give the physical scale at the main cluster redshift of z = 0.447. |
| Open with DEXTER | |
Appendix C: Selected cluster images
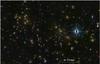 |
Fig. C.1
SCL2243-A (CFHT image). Note that this image does not cover the full extent of this cluster. The same holds for all other images below, only the central or representative parts are shown. |
| Open with DEXTER | |
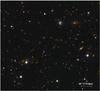 |
Fig. C.2
SCL2243-B (INT image). |
| Open with DEXTER | |
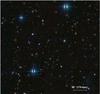 |
Fig. C.3
SCL2243-C (CFHT image). Note the sparse distribution of early-type galaxies. |
| Open with DEXTER | |
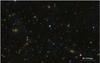 |
Fig. C.4
SCL2243-G (CFHT image). |
| Open with DEXTER | |
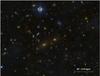 |
Fig. C.5
SCL2243-H (CFHT image). The image does not cover the full extent of this cluster. |
| Open with DEXTER | |
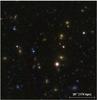 |
Fig. C.6
SCL2243-I (CFHT image). |
| Open with DEXTER | |
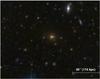 |
Fig. C.7
Part of SCL2243-J (CFHT image). The foreground cluster at z = 0.326 is outside the field of view. |
| Open with DEXTER | |
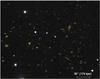 |
Fig. C.8
SCL2243-L (INT image). |
| Open with DEXTER | |
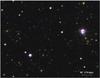 |
Fig. C.9
Part of SCL2243-M (INT image). |
| Open with DEXTER | |
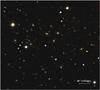 |
Fig. C.10
SCL2243-N (INT image). |
| Open with DEXTER | |
© ESO, 2011
Current usage metrics show cumulative count of Article Views (full-text article views including HTML views, PDF and ePub downloads, according to the available data) and Abstracts Views on Vision4Press platform.
Data correspond to usage on the plateform after 2015. The current usage metrics is available 48-96 hours after online publication and is updated daily on week days.
Initial download of the metrics may take a while.