| Issue |
A&A
Volume 531, July 2011
|
|
|---|---|---|
| Article Number | L12 | |
| Number of page(s) | 5 | |
| Section | Letters | |
| DOI | https://doi.org/10.1051/0004-6361/201117174 | |
| Published online | 28 June 2011 | |
Online material
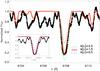 |
Fig. 4
Comparison of the observed lithium λ6707.8 Å absorption line with synthetic MOOG spectra for three values of A(Li). The 6Li/7Li isotopic ratio has been also included as a free parameter for the fit. The inset shows the comparison of the results with and without inclusion of the 6Li/7Li ratio as a free parameter (continuous and dotted lines, respectively). |
| Open with DEXTER | |
Appendix A: The ROTFIT procedure
In order to derive the astrophysical parameters of IRAS 12556 − 7731, we used a χ2 minimization procedure developed in the IDL4 environment. This procedure, which is a variation of the ROTFIT code described by Frasca et al. (2003), provides us with the best match of the observed spectrum with a grid of high-resolution spectra of real stars with well determined parameters (PASTEL catalogue, Soubiran et al. 2010) retrieved from the ELODIE archive (Moultaka et al. 2001), which is one of the largest datasets of high-resolution spectra, spanning the wavelength range 4000 − 6800 Å. Because the spectra are severely affected by molecular bands, it was difficult to perform a safe and homogeneous normalization to the local continuum for both IRAS 12556–7731 and the ELODIE templates. We thus preferred to analyse selected spectral regions, mainly around the strongest TiO bands (λλ4950, 5166, 5450, 6158, 6650, 6680 Å), normalizing the spectrum with respect to the average stellar flux in a window of ~ 10 Å blueward of the band- head (see Fig. A.1). This allowed us to fully exploit the high sensitivity to both temperature and gravity of the molecular bands (see, e.g., Neff et al. 1995). The Na i D lines, which are very sensitive diagnostics of temperature and gravity, were selected as well (Fig. 1). At the end of this procedure, for each of the five spectral regions investigated, ten templates that best matched the HARPS spectrum of IRAS 12556–7731, based on χ2 minimization, were chosen independently, and their known astrophysical parameters were used to compute weighted average values. Such average values were adopted as astrophysical parameters for IRAS 12556−7731. The results are Teff = 3460 ± 60 K, log g = 0.6 ± 0.2 dex, [Fe/H] = −0.05 ± 0.10 dex, and vsini = 6.2 ± 3.0 km s-1. The errors include the 1σ standard deviation on the average and the typical errors of the PASTEL astrophysical parameters added in quadrature. The latter are ± 50 K, ± 0.1 dex, ± 0.1 dex, and ± 0.5 km s-1 for Teff, log g, [Fe/H], and vsini, respectively.
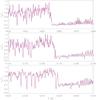 |
Fig. A.1
Portions of the HARPS spectrum of IRAS 12556–7731 around three TiO bands. The M5 III best template (HD 175865) is overplotted with dotted red lines. |
| Open with DEXTER | |
© ESO, 2011
Current usage metrics show cumulative count of Article Views (full-text article views including HTML views, PDF and ePub downloads, according to the available data) and Abstracts Views on Vision4Press platform.
Data correspond to usage on the plateform after 2015. The current usage metrics is available 48-96 hours after online publication and is updated daily on week days.
Initial download of the metrics may take a while.