| Issue |
A&A
Volume 526, February 2011
|
|
|---|---|---|
| Article Number | A151 | |
| Number of page(s) | 20 | |
| Section | Interstellar and circumstellar matter | |
| DOI | https://doi.org/10.1051/0004-6361/201015852 | |
| Published online | 13 January 2011 | |
Online material
Appendix A: Figures
Additional figures are presented in this Appendix.
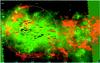 |
Fig. A.1
View of the l = 29° field (the coordinates are galactic coordinates). In red is given the 13CO emission at velocities between 75 and 85 km s-1 showing the possible molecular annulus (white circle) and in green the PACS 70 μm emission. Black circles show H ii regions (the size of the circles corresponds to the physical size, see e.g. Anderson et al. 2009) with known velocity. The colours of the source velocities correspond to: black: probable association with W43 for sources around 94 km s-1 (~5.8 kpc) and association with Sh2-65 for sources around 51 km s-1 (3.3 kpc), blue: tangent distance (~7.4 kpc), green: far or tangent distance (e.g. ~12.4 kpc for sources ~ 20 km s-1, ~7.5 kpc for sources ~95 km s-1), magenta: near distance (~5.3 kpc) and red: probable association with G29.96-0.02 (near distance, ~6.2 kpc). |
| Open with DEXTER | |
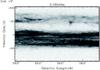 |
Fig. A.2
VGPS-HI longitude-velocity plot at the galactic latitude 0°. |
| Open with DEXTER | |
Appendix B: Tables
The columns of the following two tables are: Column 1: A complex identification number is given, the near/far/tangent distances (kpc) are also given from the mean molecular velocity and mean l,b coordinates of the complex. If it is not possible to calculate the distance or if there is no distance ambiguity, only the valid distance is given. The near, far, or tangent choice for the complex is also indicated (if not indicated, the distance in Col. 2 is adopted). Column 2: The stellar (or maser parallax) distance (kpc). Column 3: The optical name of associated H ii region(s). Column 4: Galactic coordinates of the radio H ii regions and identification of molecular clouds. “Wat”, “SW”, “A” correspond to radio sources listed mainly in Watson et al. (2003), Sewilo (2004) and Anderson et al. (2009). The molecular information is from Dame et al. (1986) for “GMC”, from Roman-Duval et al. (2009) for “GRSMC” clouds, from Solomon et al. (1987) for “Sol” clouds, from Jacq et al. (1988) for “Bx” clouds and from Simon et al. (2006) and Jackson et al. (2008) for “IRDC”. For “GMC” and “Bx” clouds the radius and velocity FWHM of the cloud is given in brackets. Note that the typical radius and velocity FWHM of “GRSMC” clouds are 0.35 ± 0.12 degrees and 3.57 ± 1.21 km s-1. These values are lower than the typical values for GMC.
Column 5: Hα velocity. When different values are found in the literature, they are given separated by a semicolon. Column 6: Radio recombination-line velocity. When different values are found in the literature, they are given separated by a semicolon. If several velocities (along the line of sight) are measured they are separated by a backslash. Column 7: Molecular line velocities (CO and/or CS). When different values are found in the literature, they are given separated by a semicolon. If several velocities (along the line of sight) are measured, they are separated by a backslash. Column 8: H2CO or OH absorption line velocities (rounded to the nearest value) detected along the line of sight of the source. When different values are found in the literature, they are given separated by a semicolon. If several velocities (along the line of sight) are measured, they are separated by a backslash. Column 9 gives the near/far/tangent solution mainly from HI emission/absorption or HI self-absorption methods and references. N means near, F means far, T means tangent. When two solutions are proposed in brackets the first comes from the HI emission/absorption method, the second from the HI self-absorption method (Anderson & Bania 2009). For sources where the two methods disagree, the favoured one by Anderson & Bania (2009) is marked with an asterisk.
Star-forming complexes in the l = 30° field.
Star−forming complexes in the l = 59° field.
© ESO, 2011
Current usage metrics show cumulative count of Article Views (full-text article views including HTML views, PDF and ePub downloads, according to the available data) and Abstracts Views on Vision4Press platform.
Data correspond to usage on the plateform after 2015. The current usage metrics is available 48-96 hours after online publication and is updated daily on week days.
Initial download of the metrics may take a while.