Fig. A.1
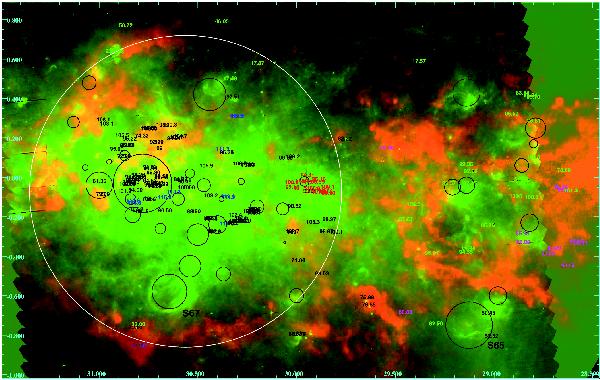
View of the l = 29° field (the coordinates are galactic coordinates). In red is given the 13CO emission at velocities between 75 and 85 km s-1 showing the possible molecular annulus (white circle) and in green the PACS 70 μm emission. Black circles show H ii regions (the size of the circles corresponds to the physical size, see e.g. Anderson et al. 2009) with known velocity. The colours of the source velocities correspond to: black: probable association with W43 for sources around 94 km s-1 (~5.8 kpc) and association with Sh2-65 for sources around 51 km s-1 (3.3 kpc), blue: tangent distance (~7.4 kpc), green: far or tangent distance (e.g. ~12.4 kpc for sources ~ 20 km s-1, ~7.5 kpc for sources ~95 km s-1), magenta: near distance (~5.3 kpc) and red: probable association with G29.96-0.02 (near distance, ~6.2 kpc).
Current usage metrics show cumulative count of Article Views (full-text article views including HTML views, PDF and ePub downloads, according to the available data) and Abstracts Views on Vision4Press platform.
Data correspond to usage on the plateform after 2015. The current usage metrics is available 48-96 hours after online publication and is updated daily on week days.
Initial download of the metrics may take a while.