| Issue |
A&A
Volume 523, November-December 2010
|
|
|---|---|---|
| Article Number | A94 | |
| Number of page(s) | 19 | |
| Section | Planets and planetary systems | |
| DOI | https://doi.org/10.1051/0004-6361/201015074 | |
| Published online | 18 November 2010 | |
Online material
Adaptive-optics imaging observational circumstances.
Lightcurves observing log.
Circumstances of the Rosetta flyby of (21) Lutetia.
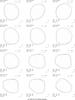 |
Fig. 3
Comparison of the KOALA shape model of (21) Lutetia to the contours extracted on the adaptive-optics images. Each vertex of the shape model is represented by a gray dot, with the exception of limb/terminator vertices, which are drawn as black dots. The median AO-contour for each epoch is plotted as a solid gray line, and the 3σ deviation area is delimited by the dotted gray lines. We report the observing time (in UT), sub-Earth point (SEP), sub-solar point (SSP) coordinates and Pole Angle (PA: defined as the angle in the plane of the sky between celestial north and the projected asteroid spin-vector, measured counter-clockwise, from north through east) on each frame. |
| Open with DEXTER | |
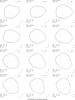 |
Fig. 3
continued. |
| Open with DEXTER | |
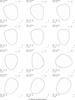 |
Fig. 3
continued. |
| Open with DEXTER | |
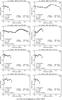 |
Fig. 4
Synthetic lightcurves obtained with the KOALA model (solid line) plotted against the 50 lightcurves (with points represented by filled dots) used in the current study, plotted in arbitrary relative intensity. The observing conditions (phase angle α, average apparent visual magnitude mV, number of points and duration of the observation) of each lightcurve are reported on each panel, along with the synthetic lightcurve fit RMS (in percent and visual magnitude). Lightcurve observations were acquired by (1 − 3) Chang & Chang (1963) (4 − 9) Lupishko et al. (1983), (10 − 11) Zappala et al. (1984), (12) Lupishko et al. (1983), (13) Zappala et al. (1984), (14 − 15) Lupishko et al. (1987), (16) Dotto et al. (1992), (17 − 21) Lupishko & Velichko (1987), (22) Lagerkvist et al. (1995), (23) Lupishko & Velichko (1987), (24) Lagerkvist et al. (1995), (25 − 28) Denchev et al. (1998), (29 − 32) Denchev (2000) (33 − 36) L. Bernasconi, (37) R. Roy, (38) Carvano et al. (2008), (39 − 40) Nedelcu et al. (2007), (41) OSIRIS on Rosetta (Faury et al. 2009), (42) Belskaya et al. (2010), (43 − 46) F. Colas, F. Vachier, A. Kryszczynska and M. Polinska, (47) R. Poncy, (48 − 49) R. Naves, (50) P. Wiggins. |
| Open with DEXTER | |
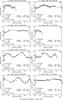 |
Fig. 4
continued. |
| Open with DEXTER | |
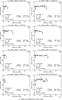 |
Fig. 4
continued. |
| Open with DEXTER | |
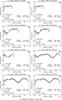 |
Fig. 4
continued. |
| Open with DEXTER | |
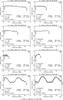 |
Fig. 4
continued. |
| Open with DEXTER | |
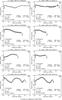 |
Fig. 4
continued. |
| Open with DEXTER | |
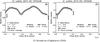 |
Fig. 4
continued. |
| Open with DEXTER | |
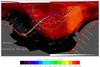 |
Fig. 5
Oblique Mercator projection of the sub-Rosetta point (SRP) and sub-solar point (SSP) paths during the Lutetia encounter on 2010 July 10 by the Rosetta spacecraft. The gray area near the South pole represents surface points where the Sun is never above the local horizon at the encounter epoch (constant shadow area). The reddish shades on the surface give the local illumination conditions at closest approach (CA), with the equatorial black band corresponding to night time at CA. Brighter shades of red depict a smaller local solar incidence angle (Sun high in sky), while darker shades represent a larger solar incidence angle. For flyby imaging, crater measurements will be much better in regions of low sun (high incidence angle), while albedo/color will be better discernible at high sun. The thin blue line is the SSP path, with the Sun traversing this path east-to-west on Lutetia’s surface. The location of the SRP with time (thick, multi-colored line) is color-coded in phase angle (see Table 4 for a detailed listing of the path coordinates as a function of time). Positions of the SSP and SRP at CA are labeled for convenience. The actual estimate of the CA time is 15:44 UT, but it may vary by a few tens of seconds, depending on trajectory-correction maneuvers that are applied to the spacecraft before the encounter. Thus, we provide times relative to CA, indicated in minutes. |
| Open with DEXTER | |
© ESO, 2010
Current usage metrics show cumulative count of Article Views (full-text article views including HTML views, PDF and ePub downloads, according to the available data) and Abstracts Views on Vision4Press platform.
Data correspond to usage on the plateform after 2015. The current usage metrics is available 48-96 hours after online publication and is updated daily on week days.
Initial download of the metrics may take a while.