Fig. 4
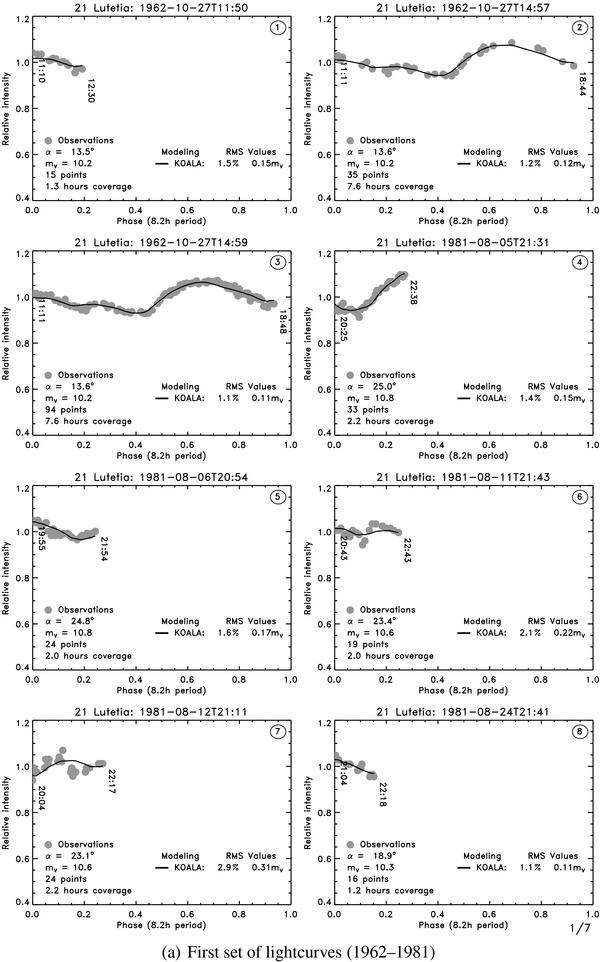
Synthetic lightcurves obtained with the KOALA model (solid line) plotted against the 50 lightcurves (with points represented by filled dots) used in the current study, plotted in arbitrary relative intensity. The observing conditions (phase angle α, average apparent visual magnitude mV, number of points and duration of the observation) of each lightcurve are reported on each panel, along with the synthetic lightcurve fit RMS (in percent and visual magnitude). Lightcurve observations were acquired by (1 − 3) Chang & Chang (1963) (4 − 9) Lupishko et al. (1983), (10 − 11) Zappala et al. (1984), (12) Lupishko et al. (1983), (13) Zappala et al. (1984), (14 − 15) Lupishko et al. (1987), (16) Dotto et al. (1992), (17 − 21) Lupishko & Velichko (1987), (22) Lagerkvist et al. (1995), (23) Lupishko & Velichko (1987), (24) Lagerkvist et al. (1995), (25 − 28) Denchev et al. (1998), (29 − 32) Denchev (2000) (33 − 36) L. Bernasconi, (37) R. Roy, (38) Carvano et al. (2008), (39 − 40) Nedelcu et al. (2007), (41) OSIRIS on Rosetta (Faury et al. 2009), (42) Belskaya et al. (2010), (43 − 46) F. Colas, F. Vachier, A. Kryszczynska and M. Polinska, (47) R. Poncy, (48 − 49) R. Naves, (50) P. Wiggins.
Current usage metrics show cumulative count of Article Views (full-text article views including HTML views, PDF and ePub downloads, according to the available data) and Abstracts Views on Vision4Press platform.
Data correspond to usage on the plateform after 2015. The current usage metrics is available 48-96 hours after online publication and is updated daily on week days.
Initial download of the metrics may take a while.