Online Material
Appendix A: Calculating central density for a double  model
model
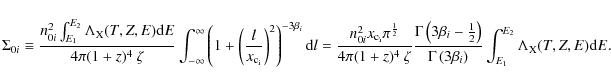
Starting from the definition of the normalization of the APEC model (Mewe et al. 1985; Smith et al. 2001; Mewe et al. 1986; Smith & Brickhouse 2000)
and taking
 with
with
 ,
(calculated individually, but generally
,
(calculated individually, but generally  1.2),
1.2),
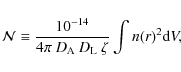
|
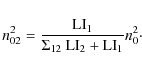
(A.1)
|
where the terms are defined as in Eq. (
9). For a
double
model the expression for
n(
r) is:
![\begin{displaymath}n(r) = \left[ n_{01}^{2} \left( 1 + \left( \frac{r}{r_{\rm c_...
...} \right)^{2} \right)^{-3\beta_{2}} \right]^{\frac{1}{2}}\cdot
\end{displaymath}](/articles/aa/olm/2010/05/aa12377-09/img288.png)
|
(A.2)
|
The unabsorbed
![[*]](/icons/foot_motif.png)
surface brightness at a projected
distance,
x from the center over an energy range between
E1 and
E2 is
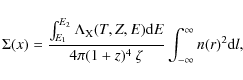
|
(A.3)
|
where
r2 =
x2 +
l2 and

is the
emissivity function for a plasma of temperature
T and metalicity
Zat energy
E. This can be rewritten in terms of
n01 and
n02 as:
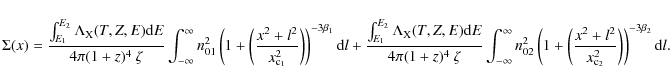
|
(A.4)
|
Solving the integral gives the standard expression for the double
model in terms of surface brightness:
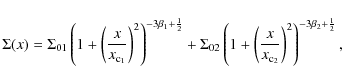
|
(A.5)
|
where
|
(A.6)
|
Therefore,
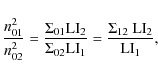
|
(A.7)
|
where LI
i and

are as defined in Eq. (
12). Using
this relation along with the fact that
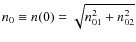
,
we find:
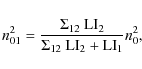
|
(A.8)
|
and
|
(A.9)
|
Inserting these values into Eq. (
A.2) to find an
expression for
n(
r) in terms of
n0, we get
![\begin{displaymath}n(r) =\frac{n_{0}}{\sqrt{\Sigma_{12}\:{\rm LI}_{2}+ {\rm LI}_...
...{2}}} \right)^{2} \right)^{-3\beta_{2}} \right]^{\frac{1}{2}}.
\end{displaymath}](/articles/aa/olm/2010/05/aa12377-09/img299.png)
|
(A.10)
|
Inserting this expression of
n(
r) into Eq. (
A.1) and
solving for
n0, we recover Eq. (
12).
Appendix B: K
 calculations
From the definition of surface brightness (Eq. (A.3)), a
cluster at redshift z, of a region with an angular radius x, has
an integrated surface brightness (or Flux
 )
between
energies E1 and E2:
)
between
energies E1 and E2:
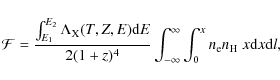
|
(B.1)
|
where

is the electron density,

is the proton density,
is the emissivity function as defined in
Eq. (
A.3). To remove the redshift dependence of the projected
region size, we convert the projected region of angular radius
x to
a cylindrical region of physical radius
R, such that

.
Equation (
B.1) becomes:
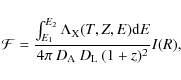
|
(B.2)
|
where

is angular diameter distance,

is the luminosity
distance and
I(
R) is defined as in Eq. (
20). Therefore the
total counts

collected by a telescope for an
observation of length

,
in an energy band from
E1 to
E2, of a cylindrical region of physical radius
R is:
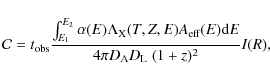
|
(B.3)
|
where

and

are the absorption from
Galactic hydrogen and the effective area of the telescope at energy
E, respectively. We can calculate
for an absorbed thermal model using
XSPEC
with an appropriate ARF and RMF. Specifically, since normalization
,
XSPEC can be used to find the constant of proportionality

.
From the definition of

(see
Eq. (
A.1)):
|
(B.4)
|
so that
|
(B.5)
|
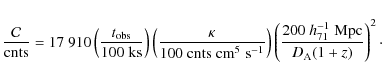
Using an on-axis
Chandra ARF and RMF, we determined
(122.3 photons cm
5 s
-1) for an energy band from 0.5-7.0 keV, with
Z = 0.25 solar,

cm
-2and our median observation time (44 ks), redshift (0.047) and virial
temperature (4.3 keV). Inserting our determined value of
into Eq. (
B.5) and solving for
I, such that
C = 10 000 counts, yields
 h71-2
h71-2 cm
-3.
Therefore using the criterion that our median observation would have

determined by circle with 10 000 counts, equivalent
regions from other observations would have:
|
(B.6)
|
Appendix C: Notes on individual clusters
C.1 A0085
This cluster appears to have two subclumps, one near the center and
one further to the south (
Kempner et al. 2002). In determining the
temperature profile and global cluster temperature the latter was
excluded. This SCC cluster hosts a well-studied radio relic, which is
close to but not connected to the central radio galaxy
(e.g.
Slee et al. 2001). The central region of this cluster requires a
double thermal model out to
11

(
12
h71-1 kpc).
C.2 A0119
This is possibly a merging cluster, which shows elongation towards the
northeast. The X-ray peak of this NCC cluster, which does not
dominate the surface brightness, has a cD galaxy cospatial with it.
The cluster contains three wide-angle-tailed (WAT) radio galaxies
which may be interacting with the ICM
(e.g.
Feretti et al. 1999).
C.3 A0133
Central regions of this cluster show an east-west elongation. An
in-depth study with
XMM and
Chandra by
Fujita et al. (2004,
2002) revealed an X-ray
tongue extending
northwest. This SCC cluster hosts a radio relic, that is close to but
not connected to the central radio galaxy (e.g.
Slee et al. 2001). The
central region of this cluster requires a double thermal model out to
15
(
16
h71-1 kpc).
C.4 NGC 0507 group
The overall X-ray spectrum of this group shows a suspicious hard tail.
An additional powerlaw component was included in the overall
temperature fit. It is possible that the hard tail is due to
unresolved low mass X-ray binaries (LMXBs), although the central
region (

kpc) was removed and no
evidence of a hard excess is seen in the spectra of the central
annuli. It is possible that (given the redshift of NGC 0507
z = 0.0165)
the LMXBs are only strong enough to be measured in a large region and
are insignificant compared to the group emission in the central
region. On the other hand the powerlaw has a steep photon index
(

)
that is not consistent with LMXBs, which
usually have a photon index of

.
The component has a
total flux of

erg cm
-2 s
-1corresponding to a luminosity of
 h71-2
h71-2 erg s
-1 (over 0.4-10.0 keV). It is also possible that the hard
excess is related to an insufficiently subtracted particle background,
which is visible in this cool cluster. Both models (additional
particle background or powerlaw) give an identical overall
temperature. We also note that a more detailed analysis of the
residual background in outer cluster regions shows no residual
particle background. The central region of this cluster requires a
double thermal model out to
62
(
20.6
h71-1 kpc).
C.5 A0262
The spectral fits to the inner regions are poor (

/d.o.f.
1.4) even with a double thermal model. Using non-solar abundance
ratios significantly improves the fit, but does not change the
best-fit overall temperature. We therefore used solar ratios for
simplicity. The central region of this cluster requires a double
thermal model out to
43
(
14
h71-1 kpc).
C.6 A0400
This cluster hosts the double radio source 3C75 within its center and
shows evidence of merging (
Hudson et al. 2006). As noted in
Hudson et al. (2006), the hydrogen column density is higher than measured
in the radio (
cm
-2 Kalberla et al. 2005) and therefore we left it free for all
spectral fits. We find a hydrogen column density of
cm
-2 for our fit to the overall
cluster.
C.7 A0399
This cluster is near to A401 and shows evidence of interaction with
A401 (e.g.
Sakelliou & Ponman 2004). The temperature profile of this
cluster peaks at the X-ray center.
C.8 A0401
See also A0399. This cluster may host a radio halo
(
Giovannini et al. 1999). We included an early observation (before 2001),
since the later observation was offset, with the cluster center in the
corner of a CCD. The BCG closest to the X-ray peak is
34
h71-1 kpc away, making it one of fourteen clusters
with the BCG >12
h71-1 kpc from the X-ray peak.
C.9 A3112
Although the background flaring seen in some observations was removed,
the effect seems to have broadened a fluorescence line. This can be
seen in the fit to the overall cluster spectrum (at
7.5 keV).
This effect seems simply to make the fit poor (
/d.o.f.
1.6), but it does not affect the best-fit values whether the
line is removed or not.
Takizawa et al. (2003) first presented the
Chandra data of A3112, interpreting the radio active central cD
galaxy as interacting with the ICM.
Bonamente et al. (2007) claim a soft
excess and hard excess in this cluster that may be related with the
central radio active BCG. We do not see a similar effect, however we
do not separately fit the 1

-2

5 annulus that
Bonamente et al. (2007) fit. We do confirm that the 1
-2
5
annulus is isothermal in our
kT-profile so that their result is not
due to a temperature fluctuations in the cluster. This SCC cluster is
one of sixteen clusters for which no data exist for the BCG central
velocity dispersion.
C.10 NGC 1399/Fornax cluster
This nearby SCC cluster has two X-ray peaks cospatial with
NGC 1399 and
NGC 1404. The X-ray peak is taken to be cospatial
with the BCG
NGC 1399. The peak on
NGC 1404 was removed for
spatial and spectral analysis. Fornax appears to be an outlier in six
of the plots of parameters versus CCT in which it has an anomalously
low value for its CCT. These parameters are: (1)

;
(2)

/
r500; (3)
;
(4) cooling radius; (5)

/
M500 and (6)

/
M500.
Additionally it is the only SCC cluster in which

.
One possible explanation
is that
NGC 1404 is about
0.04
r500 from the X-ray peak and
due to the extended emission around it, the surface brightness profile
severely flattens. The extrapolated outer profile therefore
overestimates the projected gas lowering the central density (and
altering associated parameters). To check how much this influenced
the Fornax cluster as an outlier, we fit only the central part of the
surface brightness that could be fit well to a single
-model.
This model most likely underestimates the projected gas, thereby
providing the largest possible values for central density. In the
case of Fig.
10, this model raises
to


yr
-1making it larger than
yr
-1. We emphasize that this result overestimates
and in any case


,
making it an odd SCC cluster. In
all other cases the Fornax cluster remains an outlier. In the case of
the CCT the value falls to
0.4
h71-1/2 Gyr moving the
Fornax cluster to the left in Fig.
6. (1)
,
not surprisingly, remains almost the same,

photons cm
-2 s
-1 arcsec
-2. The
shift to the left in this case makes the Fornax cluster even more of
an outlier. (2)

,
likewise, remains almost identical,

.
Unlike,
,
the shift to the
left in this case makes the Fornax cluster more similar to other SCC
clusters. (3)
is, of course, unaffected by the density
model, however moving the Fornax cluster to the left makes it more
consistent with the other SCC clusters. (4) The cooling radius
remains almost identical, increasing to
0.03
r500. Additionally
moving the Fornax cluster to the left makes it even more of an
outlier. (5)
/
M500 increases slightly to
 h71-1
h71-1 yr
-1. Moving the
Fornax cluster to the left makes the trend of decreasing
/
M500 with CCT worse, but it is more consistent with
other groups with short CCT. (6)
/
M500, is raised
slightly,

.
Similar to
/
M500, moving the Fornax cluster to the left makes
the trend with CCT worse, but makes it more consistent with the other
groups. We emphasize that the Fornax cluster is still an outlier in
all six cases, and that these values are the other extrema, with the
true value somewhere between these and where they are plotted in
Fig.
6. The physical interpretation is that it is
possible that Fornax is in the process of forming a cool core (i.e. it
has a nascent core in the terms of
Burns et al. (2008)) and therefore is
dynamically different from the other SCC clusters that have
well-established cores. The central region of this cluster requires a
double thermal model out to
170
(
15.9
h71-1 kpc).
C.11 2A0335+096
This cluster, along with A0478 and NGC 1550, has a significantly higher
hydrogen column density than measured at radio wavelengths
(
 cm-2 Kalberla et al. 2005). We fit
all spectra with the column density free. For the fit to the overall
spectrum we find
cm-2 Kalberla et al. 2005). We fit
all spectra with the column density free. For the fit to the overall
spectrum we find
 cm-2. This
cluster has two major galaxies near the X-ray peak, which resides
between the two of them (10
h71-1 kpc from the closest).
Of the 16 clusters in which no information about the BCG central
velocity dispersion is available, this cluster has the shortest CCT.
The central region of this cluster requires a double thermal model out
to 38
(26
h71-1 kpc).
cm-2. This
cluster has two major galaxies near the X-ray peak, which resides
between the two of them (10
h71-1 kpc from the closest).
Of the 16 clusters in which no information about the BCG central
velocity dispersion is available, this cluster has the shortest CCT.
The central region of this cluster requires a double thermal model out
to 38
(26
h71-1 kpc).
C.12 IIIZw54
IIIZw54 is a pair of galaxies near the
center of a poor galaxy group. We used a 6
kernel when
smoothing the image in order to determine the emission peak. This
cluster does not have a bright core, although it appears to be quite
round and relaxed. The brighter of two galaxies in the galaxy pair
IIIZw54 (a cD galaxy) is cospatial with the X-ray peak.
C.13 A3158
okas et al. (2006) report A3158 as a relaxed cluster based on the
velocity dispersion of the galaxies. The X-ray emission appears to be
elliptical and there are two cDs near the cluster center, one of which
lies at the X-ray peak. This cluster definitely does not have a bright
core, with a central density of only

cm
-3. The temperature profile peaks in the center at
5.7 keV.
C.14 A0478
This cluster, along with 2A0335+096 and NGC 1550, has a significantly
higher hydrogen column density than measured in the radio (
cm
-2 Kalberla et al. 2005). We fit all spectra
with the column density free. Our fit to the overall cluster yields a
column density of (
cm
-2),
consistent with the value found by
Sanderson et al. (2005). This cluster
has the highest spectral mass deposition rate of any
HIFLUGCS
cluster, making it an ideal candidate for a grating observation.
Unfortunately the
RGS data from a long
XMM-Newton exposure
was virtually unusable (
de Plaa et al. 2004). This SCC cluster is also one
of sixteen clusters in which no data for the BCG central velocity
dispersion are available.
C.15 NGC 1550 group
This cluster, along with 2A0335+096 and A0478, has a significantly
higher hydrogen column density than measured in the radio (
cm
-2 Kalberla et al. 2005). We fit all spectra
with the column density free. Our fit to the overall cluster yields a
column density of
cm
-2. The
column density appears to peak towards the center of the cluster,
having a value of
cm
-2 in the
innermost annulus.
C.16 EXO0422-086/RBS 0540
The short observation of this SCC cluster indicates a round, centrally
peaked cluster with a moderate central temperature drop. The BL Lac
object EXO 0423.4-0840 at the center of this cluster was studied by
Belsole et al. (2005). This is one of sixteen clusters for which no data
about the BCG central velocity dispersion are available.
C.17 A3266
This cluster has a very low background scaling factor; therefore an
additional unfolded powerlaw component was included in the spectral
fits to account for any residual particle background. Reading in the
background as a corfile (i.e. a second background component with an
adjustable scaling factor), the overall best-fit temperature is found
to be consistent with our result including an unfolded powerlaw.
Henriksen & Tittley (2002);
Finoguenov et al. (2006) presented detailed analyses of this
merging system.
C.18 A0496
The high abundances in the central region of this cluster are better
fit with a VAPEC model, however since this did not change the best-fit
values of temperature, solar ratios were used for simplicity. A
double thermal model greatly improved the fits to spectra in annuli
out to 0
3. However, the high temperature component for annuli
between 0
18 and 0
3 is


(

keV). Although this may be evidence of very hot gas near the cluster
core, the investigation is beyond the scope of this paper. Therefore
for annuli between 0
18 and 0
3, we used a single
thermal fit.
Dupke et al. (2007a) studied the longest of the
three
Chandra observations of this cluster in depth. They argue
that there is a cold front at the center of this cluster, which is
caused by an off-center passage of a smaller dark matter halo.
C.19 A3376
This cluster was fit with an unfolded powerlaw component to account
for possible low-level flares in both observations. This cluster
appears highly disturbed in the X-ray with a strong elongation along
the east-west direction.
Bagchi et al. (2006) report the existence of
double relics, one to the east of the cluster center and one to the
west.
Nevalainen et al. (2004) found a diffuse, hard excess with the
BeppoSAX PDS at 2.7

significance. The BCG of this cluster
is
1 Mpc from the X-ray peak, the most distant of any cluster in
the sample and one of eight clusters with a separation of
>50
h71-1 kpc. There is a radio galaxy with bent jets very
close to the X-ray peak (
Mittal et al. 2009). Optically it is clearly
much fainter than the BCG and is most likely an AGN that may have been
activated by the merger. The jets are bent in the opposite direction
to the elongation of the cluster, possibly bent from ICM ram pressure.
C.20 A3391
The short observation of this NCC cluster shows an elliptical shaped
ICM with a BCG cospatial with the emission peak.
Tittley & Henriksen (2001)
discovered a filament between A3391 and the nearby cluster A3395.
C.21 A3395s
This cluster is very close to and may be interacting with A3395e.
A3395e was excluded from all extended analysis.
Donnelly et al. (2001)
claim A3395s and A3395e are near first core passage.
C.22 A0576
Kempner & David (2004) originally presented an analysis of the
Chandra data.
Dupke et al. (2007b) presented a detailed analysis of the
XMM-Newton and
Chandra data suggesting that it is a
line-of-sight merger. The X-ray image seems somewhat perturbed with
elliptical isophotes with alternating NW-SE shifted centers,
reminiscent of sloshing, already noted by
Kempner & David (2004). The BCG
is
24
h71-1 kpc from the X-ray peak, making it one of
fourteen clusters with the separation >12
h71-1 kpc. There
is, however, a slightly fainter galaxy closer
(<12
h71-1 kpc) to the X-ray peak that is radio active,
whereas the BCG is not. The peculiar velocity of the BCG is one of
five clusters that is more than 50% of the velocity dispersion. This
WCC cluster is one of the three WCC/NCC clusters with
CCT
1
h71-1/2 Gyr (i.e. not on the border between SCC and
WCC) and a systematic temperature decrease at the cluster center.
C.23 A0754
This irregularly shaped cluster hosts a halo and relic
(
Kassim et al. 2001).
Henry et al. (2004) presented a detailed analysis of
this merging system using the
XMM-Newton observation. Only the
pre-2001
Chandra observation is used, since it was the only one
that contained the cluster core. More recent observation have been
made but do not cover the cluster center and therefore are not useful
for core studies. The BCG for this cluster is
714
h71-1 kpc away from the X-ray peak, making it one of
eight clusters where this separation is >50
h71-1 kpc.
C.24 A0780/Hydra-A cluster
This cluster is known to have a massive central AGN outburst (
Nulsen et al. 2005).
C.25 A1060
This WCC cluster is also known as the Hydra cluster.
Sato et al. (2007)
recently presented a
Suzaku observation of this cluster. This
cluster has two bright galaxies near the core, one of which is
cospatial with X-ray peak. Both galaxies have a clearly visible
diffuse X-ray component (
Yamasaki et al. 2002).
C.26 A1367
Due to the short exposure time and lack of a bright core, we used a
12
kernel when smoothing to determine the X-ray peak. This
is a very well-studied merging cluster. This cluster has an infalling
starburst group (
Cortese et al. 2006;
Sun et al. 2005) and optical evidence suggests
that this is a merging system (
Cortese et al. 2004). The X-ray image
appears rather disturbed with several off-centered bright sources.
Sun & Vikhlinin (2005) studied the survival of galaxy coronae in this system.
This cluster hosts a radio relic (
Gavazzi & Trinchieri 1983). The BCG of this
cluster is
666
h71-1 kpc from the X-ray peak making it
one of eight clusters where this separation is
>50
h71-1 kpc. It is also one of five clusters where the
BCG peculiar velocity is >50% of the cluster velocity dispersion.
C.27 MKW4
A single thermal model is a poor fit to this high metalicity center.
Although a second thermal model does provide an improvement, freeing
the ratio of elements for a single thermal model provides the
best-fit. Since freeing the abundance ratios does not change the
overall best-fit temperatures of the annuli, solar ratios with a
single thermal model were used for simplicity.
C.28 ZwCl 1215.1+0400
The short observation of this NCC cluster, shows a round cluster with
no bright central peak and an elliptical BCG located at the X-ray
emission peak. This is one of the sixteen clusters for which no data
about the BCG central velocity dispersion are available. The BCG of
this clusters is also
18
h71-1 kpc from the X-ray peak,
making it one of fourteen clusters where this separation is
>12
h71-1 kpc.
C.29 NGC 4636 group
This nearby group contains extended nonthermal emission in the central
region extending out
122
(
9.19
h71-1 kpc). The luminosity of this emission (
 h71-2
h71-2 erg s
-1) is consistent with the
expected unresolved LMXB population for NGC 4636.
In addition to a powerlaw component, the central region of this
cluster requires a double thermal model out to
35
(
2.6
h71-1 kpc).
C.30 A3526/Centaurus cluster
This is a well-studied, prototypical CC cluster, with a central
temperature drop (having the largest fractional drop,

)
and enhanced central metalicity. An arc-like
X-ray feature near the center has been identified as most likely being
a cold front associated with sloshing in the core
(
Sanders & Fabian 2002). The central region of this cluster
requires a double thermal model out to
72
(
16.5
h71-1 kpc).
C.31 A1644
As with A0085, this SCC cluster shows evidence of merging, with the
existence of a double X-ray peak.
Reiprich et al. (2004) analyzed the
XMM EPIC observation of this cluster. They found the flux
of the northern (smaller) subclump is below the
HIFLUGCS flux
limit whereas the flux of the southern (larger) subclump is above the
flux limit. Therefore for purposes of this analysis the smaller
subclump was excluded from spatial and spectral analysis.
Additionally
Reiprich et al. (2004) found evidence that the smaller
sub-clump was being stripped as it passes through the ICM. This is
one of sixteen clusters in which the central velocity dispersion of
the BCG is unavailable. The central region of this cluster requires a
double thermal model out to
32
(
30
h71-1 kpc).
C.32 A1650
This CC cluster hosts a radio quiet cD galaxy (
Donahue et al. 2005).
Mittal et al. (2009) find an upper-limit to the bolometric radio
luminosity of
 h71-2
h71-2 erg s
-1.
The original short
Chandra observation showed a flat temperature
profile (
Donahue et al. 2005). However, the longer, mosaiced observations
show a slight temperature decrease in the central region. Due to the
elevated entropy in the core,
Donahue et al. (2005) concluded a major AGN
outburst had disrupted the cooling flow. This cluster is one of four
clusters on the border between SCC and WCC. Its CCT
(
1.2
h71-1/2 Gyr) is slightly longer than the 1 Gyr
cutoff. Moreover this cluster shows a central temperature decrease
typical of SCC clusters. This is one of sixteen clusters in which the
central velocity dispersion of the BCG is unavailable.
C.33 A1651
As with A1650,
Donahue et al. (2005) claim this is a radio quiet CC cluster, however
Mittal et al. (2009) detect central radio emission with
a bolometric luminosity of
10
40
h71-2 erg s
-1.
Gonzalez et al. (2000) fit the optical light out to
670
h100-1 kpc, over one quarter of

.
The
X-ray structure looks quite round and shows no evidence of external
interaction. However, the X-ray peak does not dominate as much as in
SCC clusters and there is no evidence of a central temperature drop.
This WCC is one of sixteen clusters in which the central velocity
dispersion of the BCG is unavailable.
C.34 A1656/Coma cluster
This well-studied NCC cluster appears to be involved in a merger with
a group.
This cluster hosts the first detected radio halo (
Willson 1970).
C.35 NGC 5044 troup
The spectra for the inner regions of this group are not well fit by a
single thermal model (
/d.o.f. > 2). After trying several
different models to fit the residuals, we found that the statically
best model which is also physically motivated is a thermal model that
allows oxygen, silicon, sulfur, and iron to vary from solar ratios and
a powerlaw to account for a the clear hard tail (most likely due to
LMXBs). We note that a double thermal model with the above elements
not constrained at solar ratios provides the statistically best-fit
(in the innermost annulus
/d.o.f. = 1.04 vs.
/d.o.f. = 1.13
for the thermal plus powerlaw model). In this model, however, the
hotter thermal model has a temperature of
kT = 1.4-3.0 which is
hotter than any gas found in the outer annuli and the measured virial
temperature (

). Unless there is
a hot halo of gas extending from the center of the group out to
16
h71-1 kpc, this model is unphysical. Finally, we note
that adding a powerlaw to the second thermal model does not improve
the fit and similar high temperatures are found for the hotter thermal
component as for the simple two thermal model.
C.36 A1736
This NCC cluster is a member of the Shapley Supercluster. Due to the
short exposure time and lack of a bright core, the X-ray peak was
found by smoothing the image with a
10
kernel. The
X-ray morphology shows an irregular shape with no well-defined core.
A preliminary temperature map shows heating to the east and west of
the emission peak with cool gas extending to the south. The BCG of
this cluster is
642
h71-1 kpc from the peak, making it
one of eight clusters where this separation is >50
h71-1kpc. This is the only cluster with a separation of
>50
h71-1 kpc that does not have any known associated radio
halo or relic.
C.37 A3558
This WCC cluster is located in the core of the Shapley Supercluster.
The observation was heavily flared, and even after a conservative
cleaning of the light curve there was evidence of some low-level
flaring in the back-illuminated chips.
Rossetti et al. (2007) presented
the
XMM and
Chandra analysis of this cluster, concluding
that it had a cool core that had survived a merger. We find evidence
of a slight temperature drop in the core of this WCC cluster.
C.38 A3562
This WCC cluster is located in the core of the Shapley Supercluster.
The X-ray emission from this cluster appears to be elongated along the
northeast-southwest direction.
Giacintucci et al. (2005) report the
detection of a radio halo (also see
Venturi et al. 2000) and argue for
a merger scenario between A3562 and SC 1329-313.
Finoguenov et al. (2004)
presented a detailed analysis of the
XMM observation of this
cluster. The BCG of this cluster is
31
h71-1 kpc from
the X-ray peak, making it one of fourteen clusters where this
separation is >12
h71-1 kpc. However, the BCG is located in
a chip gap, so the separation may simply be an instrumental effect
(i.e. the peak on the BCG may not be detected due to the chip gap).
The
XMM observation also shows an offset between the X-ray peak
and BCG but on a scale of only
23
h71-1 kpc
(Zhang, private communication).
C.39 A3571
This WCC cluster is a member of the Shapley Supercluster.
C.40 A1795
The core of this well-studied SCC cluster has a large filament seen in
X-rays and H

(
Crawford et al. 2005). Early core studies
with
Chandra were done by
Fabian et al. (2001) and
Markevitch et al. (2001).
Fabian et al. (2001) found a CCT
of
0.4
h71-1/2 Gyr, approximately the same age as they
estimate for the filament. The difference between their measurement
for CCT and our measurement is probably due to the different values of

used to determine CCT. In order to keep consistency
between clusters we determined the CCT at 0.004
r500, however at
the redshift of A1795 we are able to determine the CCT at an even
smaller radius which gives a CCT
0.5
h71-1/2 Gyr,
consistent with
Fabian et al. (2001). Moreover, their
technique for determining CCT is slightly different from
ours.
Markevitch et al. (2001) found a cold front in the core of
A1795, which they attribute to sloshing gas.
Oegerle et al. (2001) studied
FUSE observations and found
an upper limit for
(20 kpc

yr
-1, consistent with our measurement of
15
yr
-1.
C.41 A3581
This SCC cluster is a member of the Hydra-Centaurus Supercluster.
The central region of this
cluster requires a double thermal model out to
40
(
18
h71-1 kpc).
Johnstone et al. (2005) analyzed
the
Chandra data from A3581. They find a point source
coincident with the powerful radio source PKS 1404-267 at the cluster
center. They find a central temperature drop to
0.4
at the cluster center, similar to our measurement of
0.5
.
C.42 MKW8
This NCC cluster shows little substructure in the X-ray image. The
X-ray isophotes are elliptical with the major axis along the east-west
direction. The isophotes seem to have a common center (i.e. no
evidence of sloshing), however the X-ray peak appears to lie to the
east of the center of the isophotes. There are two bright galaxies at
the center of the cluster. The brighter of the two corresponds to the
X-ray peak (which unfortunately falls in a chip gap). The second
galaxy is to the east, corresponding to the direction of the
elongation of the surface brightness. This cluster shows a possible
radio relic at 74 MHz in the VLA Low-Frequency Sky Survey (VLSS)
data. The extended radio emission is northwest of the X-ray peak and
extends southwest to northeast
165
h71-1 kpc at the
resolution of the VLSS (
Cohen et al. 2007).
C.43 RX J1504.1-0248/RBS 1460
RX J1504 is the cluster with the highest redshift and X-ray luminosity
in
HIFLUGCS, and shows the largest classical mass deposition
rate.
Böhringer et al. (2005) reported the results to the
Chandra
observation of this cluster. This cluster was originally not included
in
HIFLUGCS because its X-ray flux is only slightly (<20%)
above the flux limit. RX J1504 appears only marginally extended in the
ROSAT All-Sky Survey. Additionally the galaxy at the center of
the X-ray emission is classified as AGN
(
Machalski & Condon 1999)
and its optical spectrum shows emission lines. It was assumed that
even if there is only a small AGN contribution from the central AGN to
the total X-ray flux (
20%), the cluster would fall below the
flux limit. However, the
Chandra image reveals that there is
actually no significant point source emission at the center of this
cluster (
Böhringer et al. 2005), which argues against any significant
contamination by AGN emission. Therefore, this
cluster is included into
HIFLUGCS. The BCG features a compact and
flat-spectrum radio source (
Mittal et al. 2009). This SCC cluster is one of
sixteen clusters in which the BCG's central velocity dispersion is not
available.
C.44 A2029
The spectra of the inner annuli fit best to non-solar metalicity
ratios, but freeing ratios does not change the best-fit temperatures,
so solar ratios were used for simplicity.
Clarke et al. (2004)
studied the core of this cluster in detail with
Chandra.
C.45 A2052
The central region of this cluster requires a double thermal model out
to
45
(
32
h71-1 kpc).
Blanton et al. (2001) found prominent X-ray cavities in the
original
Chandra observation. They determined these cavities to
be cospatial with radio lobes from the central radio source.
C.46 MKW3S/WBL 564
This SCC cluster shows some disruption in the core and bubbles to the
south (
Mazzotta et al. 2004). MKW3S is one of sixteen clusters in which
data about the BCG's central velocity dispersion are not available.
This cluster is a member of the Hercules Supercluster.
C.47 A2065
A2065 is a member of the Corona Borealis Supercluster, in projection
close to the Hercules Supercluster but twice as distant. This cluster
is one of four clusters on the border between SCC and WCC clusters.
Its CCT is (
1.3
h71-1/2 Gyr) is slightly longer than the
1 Gyr cutoff. This cluster shows an inwardly decreasing temperature
profile as seen in the SCC clusters. This cluster is one of sixteen
clusters in which the BCG's central velocity dispersion is not
available. It is one of five clusters where the BCG peculiar velocity
is more than 50% of cluster velocity dispersion. This offset
suggests possible sloshing which may have disrupted the CC. Based on
the
Chandra data,
Chatzikos et al. (2006) suggest that the cluster
is involved in an unequal mass merger and that one cool core has
survived the merger.
Feretti & Giovannini (1994) identified a WAT
19
(1.6
h71-1 Mpc) south south-west of the
cluster center. The jets of the WAT are bent away from the center of
the cluster. In the NRAO VLA Sky Survey at 1.4 GHz
(NVSS
Condon et al. 1998), there appears to be a diffuse radio source
91
(
124
h71-1 kpc) to the southwest of
the cluster center. It is unclear whether this source is associated
with the central radio source.
C.48 A2063
This WCC cluster appears to have a very regular morphology in X-rays,
with some hint of an elongation to the northeast. The BCG resides at
the X-ray peak. The NVSS shows three bright radio sources in a line
along an axis from southwest to northeast but only the center source
is associated with the BCG, while the other two are cospatial with two
neighbouring galaxies. As with many WCC clusters this cluster shows a
flat central temperature profile and a raised central entropy
K0
> 50
h71-1/3 keV cm
2. This cluster is close to MKW3S.
C.49 A2142
This cluster has a double cold front (
Markevitch et al. 2000). The
separation between the BCG and the X-ray peak is
23
h71-1 kpc for this cluster, making it one of fourteen
with this value >12
h71-1 kpc. This is one of sixteen
clusters in which no data is available for the BCG's central velocity
dispersion. It is possible this cluster hosts a radio halo, but the
evidence remains dubious (
Giovannini & Feretti 2000).
C.50 A2147
A2147 is a member of the Hercules Supercluster. Due to the short
observing time combined with the lack of a bright core, we used a
10
kernel when smoothing to determine the X-ray peak of this
NCC cluster. There are three bright galaxies in a line near the core,
of which the northernmost (the BCG) is located at the X-ray peak.
This is one of the six NCC clusters in which

.
The X-ray morphology indicates that it is a merging cluster. The
X-ray emission extends toward the south from the peak following the
line of the three bright galaxies as well as extending to the
southeast. There is, additionally, a sharp drop in the X-ray emission
to the northwest. We argue that the observed
is
not due to cooling, but results from multiple temperatures along the
line of sight caused by the merger. Although the cluster has been
labeled as a CC cluster in the past (e.g.
Henriksen & White 1996),
Sanderson et al. (2006a) found it to be an NCC cluster and likely merger
system.
C.51 A2163
This well-known merging cluster contains the largest known radio halo
(
Feretti et al. 2001). The separation between the BCG and X-ray peak is
158
h71-1 kpc for this cluster, making it one of eight
clusters where this value is >50
h71-1. Our measurement of
(
16 keV) is higher than the value of
12 keV
found by
Markevitch & Vikhlinin (2001) with data from the original,
shorter
Chandra observation. However, a recent measurement by
Vikhlinin et al. (2009), using the same
Chandra as we, finds

keV, more consistent with our result. The
difference between our result and
Vikhlinin et al. (2009) is
barely inconsistent within 1
and is probably due to
differences in the techniques used to determine
in this
extremely hot cluster. This is the second most distant and hottest
cluster in the
HIFLUGCS sample. This is one of sixteen clusters
for which data on the BCG's central velocity dispersion are not
available, however, since the BCG is not cospatial with the X-ray peak
so this information is not important for our analysis.
C.52 A2199
The central region of this cluster requires a double thermal model out
to
29
(
17
h71-1 kpc).
C.53 A2204
Recently
Reiprich et al. (2009) determined the temperature of
this cluster out to
r200 using
Suzaku. They find that
the temperature declines all the way from 0.3
r200 to
r200,
consistent with predictions of simulations. This is one of sixteen
clusters where data on the BCG's central velocity dispersion is not
available.
C.54 A2244
As with A1651,
Donahue et al. (2005) claim it to be a radio quiet CC cluster, but
Mittal et al. (2009) detect central radio emission with a
bolometric luminosity of
 h71-2
h71-2 erg s
-1. Although this is not particularly luminous, it is
consistent with radio activity in other CC clusters
(
Mittal et al. 2009). Due to elevated entropy in the core,
Donahue et al. (2005) concluded a major AGN outburst had disrupted the
cooling flow. Like many WCC clusters, this cluster shows a flat
temperature profile. However, we point out that the same was true of
A1650 until a deeper observation revealed a slight temperature drop in
the core. This is one of sixteen clusters in which the central
velocity dispersion of the BCG is unavailable.
C.55 A2256
This well-known merging cluster is the only one of two NCC clusters
that shows a systematic temperature decrease in the center. The
temperature decrease is the largest of any NCC or WCC cluster.
Surprisingly, the separation between the BCG and X-ray peak is
132
h71-1 kpc for this cluster, making it one of eight
clusters where this value is >50
h71-1 kpc. Since this
separation is quite large, the cool gas is not associated with the
BCG. It is most likely this gas is the remnant of a CC (perhaps from
a merging group) that has been stripped from its central galaxy. This
cluster hosts both a radio halo and relic
(e.g. Clarke & Ensslin 2006; Bridle & Fomalont 1976)
C.56 A2255
Due to a short exposure time and lack of a bright core, we used a
10
kernel when smoothing the image to determine the X-ray
peak. The separation between the BCG and X-ray peak is
72
h71-1 kpc, making it one of eight clusters where this
value is >50
h71-1 kpc. This cluster BCG also has by far
the largest peculiar velocity of any cluster; almost twice the
velocity dispersion of the cluster. This cluster hosts both a radio
halo and a relic (e.g.
Feretti et al. 1997).
C.57 A3667
This well-known merging cluster shows a very sharp cold front
(
Vikhlinin et al. 2001b,
a) and two radio relics
(e.g.
Roettiger et al. 1999). The separation of the BCG and X-ray peak
is
155
h71-1 kpc for this clusters making it one of
eight clusters where this value is >50
h71-1 kpc. This is
the only WCC cluster with such a larger separation; however, A3667 is
on the border between NCC and WCC clusters, with
CCT
6
h71-1 Gyr.
C.58 S1101/Sérsic 159-03
Kaastra et al. (2001) provided a detailed analysis of the
XMM-Newton
RGS and
EPIC data. Recently
Werner et al. (2007) have claimed
discovery of a diffuse soft excess seen by
XMM-Newton and
Suzaku and suggest it is of non-thermal origin. This is one of
sixteen clusters in which the central velocity dispersion of the BCG
is unavailable.
C.59 A2589
This WCC shows a systematic temperature drop towards the center,
albeit rather flat (
kT0/
kT = 0.93 and

). Like
A1650, it is on the cusp between SCC and WCC clusters.
Zappacosta et al. (2006) studied this cluster with a radio-quiet BCG in
detail with
XMM-Newton. They find the cluster to be
exceptionally relaxed with a gravitating matter profile that fits a
NFW profile with

and
(
Mpc). They conclude that processes during halo formation act
against adiabatic contraction. Additionally
Buote & Lewis (2004) studied
the original short
Chandra observation that suffered from
flaring.
Following a method to determine the residual CXB (similar to what is
described in Sect 2.3), we measured the surface brightness
profile out to 750
h71-1 kpc (0.5
). We
fit this surface brightness profile to a double-
model and the
temperature profile to a broken powerlaw. The slope of the inner kTprofile was fixed at zero and the outer kT profile fit well to a
powerlaw of slope -0.36 with a break radius of 4
2 (204
h71-1 kpc). Using the fit to the temperature profile and
double -model, we find a virial mass and radius of
 h71-1
and
h71-1
and
 Mpc respectively, consistent with
the results of Zappacosta et al. (2006).
Mpc respectively, consistent with
the results of Zappacosta et al. (2006).
C.60 A2597
McNamara et al. (2001) analyzed the original, short, flared observation of
A2597, noting the ghost bubbles.
Morris & Fabian (2005) found high spectral
mass deposition rates from the
XMM-Newton EPIC and
RGS consistent with
100
yr
-1 down to almost
0 keV, although the improvement to the spectral fits of the
RGS
data from the addition of a cooling flow model is marginal. The long
Chandra ACIS observation shows a mass deposition rate of
150
yr
-1 down to
1.3 keV and dropping to
10
yr
-1 down to
0 keV.
C.61 A2634
This WCC cluster contains the WAT source 3C465. There is a pair of
galaxies (NGC 7720) located at the X-ray peak. An extended bright X-ray
halo (radius =

), much brighter than the ICM emission,
is cospatial with the galaxy pair. The halo seems to be associated
with the larger southern galaxy. A2634 is the only CC cluster in the
sample with

.
The
temperature profile shows a sudden drop at
2
7
(
100
h71-1 kpc). Other than NGC 7720, there is no obvious
core in A2634 and the elongation of the ICM to the southwest is
consistent with a merging cluster. Moreover the
inverted
temperature profile is more common in NCC clusters than in WCC
clusters. We interpret the short cooling time and low
as a cool core that has either been disrupted or is in
the process of being destroyed by a merger.
may
reflect the original mass deposition rate, but probably is strongly
affected by multitemperature components along the line of sight in a
merging system.
C.62 A2657
This WCC cluster has a slight increase in temperature in the central
region. The
Chandra image shows a cluster similar to e.g. A1650
and A2244. The central emission peak is clearly visibly but is not as
sharply peaked as in SCC clusters. The overall ICM appears to be
quite round, with some sloshing features (differently centered X-ray
isophotes at different radii) in the central region.
C.63 A4038
The distance between the BCG and X-ray peak is
12.4
h71-1 kpc for this cluster making it one of
fourteen clusters where this separation is >12
h71-1 kpc.
This cluster hosts a radio relic, close to but not connected to the
central radio galaxy (
Slee & Roy 1998).
C.64 A4059
The central region of this cluster requires a double thermal model out
to
22
(
20
h71-1 kpc).
Table 2:
Observational parameters.
Table 3:
Derived parameters.