| Issue |
A&A
Volume 507, Number 2, November IV 2009
|
|
|---|---|---|
| Page(s) | 861 - 879 | |
| Section | Interstellar and circumstellar matter | |
| DOI | https://doi.org/10.1051/0004-6361/200912325 | |
| Published online | 24 September 2009 | |
Online Material
Appendix A: The use of HCO+ as a dense gas tracer
A.1 Outflow cavities in TMR1, TMC1A and GSS30-IRS1
The HCO+ 3-2 alignment with the near-infrared scattering nebulosities in the HST images for TMR1, TMC1A and GSS30-IRS1 (Fig. 10) is similar to what has been found in high angular resolution observations of the lower excitation 1-0 transition in both Class I (Hogerheijde et al. 1997a) and Class 0 (Jørgensen 2004) sources.
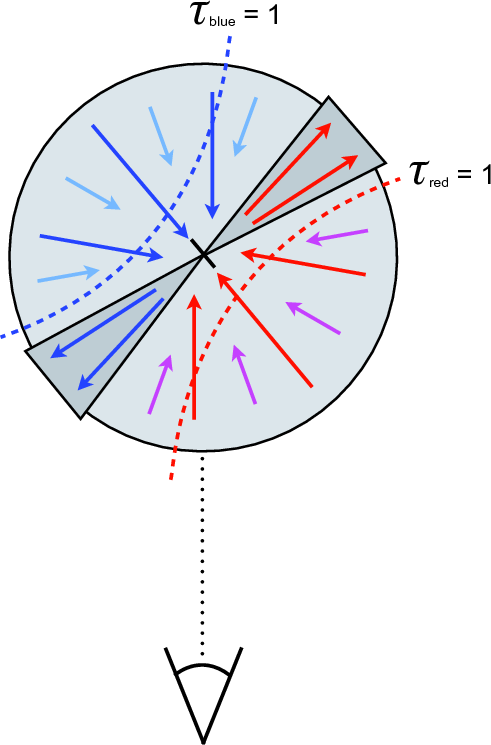
The patterns in the velocity maps (Fig. 11) support the interpretation that the HCO+ 3-2 emission has its origin in one-side of the outflow cone: in all maps the HCO+ emission is blue-shifted with respect to the systemic velocity with the most extreme velocities (most blue-shifted) narrowly confined around the continuum position and material closer to the systemic velocity extending around this. This signature can best be understood in a simple geometry where HCO+ probes material in a large infalling protostellar envelope being swept up by the outflow, as illustrated in Fig. A.1. If the velocities in the swept-up material are relatively small (comparable to the infalling velocities in the envelope) and HCO+ 3-2 optically thick, the front-side of the envelope (toward us) will be slightly red-shifted due to the infall and thus obscure the outflowing material in the red-shifted cone on the far-side of the envelope (Fig. A.1), which in turn is resolved-out. In contrast, the outflow cone pointed toward us will be unobscured by the envelope. Likewise, the near-infrared scattered light from the red-lobe would largely be blocked - in contrast to the scattered emission from the outflow cavity on the front-side. An alternative explanation is that all the sources are at the far-side of their respective clouds, the red-shifted part of the outflow cone breaking out into a low-density medium not observable in the line tracers. This would require a rather sharp density gradient, however.
|
Figure A.1:
Schematic figure of a collapsing envelope with an outflow
sweeping up material. The dashed lines indicate the |
| Open with DEXTER | |
A.2 Limitations of HCO+ 3-2 as a tracer of disks
The results above suggest that HCO+ 3-2 is a good tracer of
motions in disks for envelopes that have already been largely
dispersed. For the more embedded YSOs, HCO+ 3-2 emission may be of
limited use as a tracer of rotation in the disk due to its optical
thickness. A simple estimate can be made of the typical envelope mass
below which HCO+ 3-2 line emission is optically thin in the
envelope and can be used as a tracer of the kinematics in the
innermost regions of the protostar. First, for typical envelope
parameters we expect temperatures in the range of 15-40 K and
densities of 104-107 cm-3. Using the Radex escape
probability code (van der Tak et al. 2007)![]() for these
parameters, the HCO+ 3-2 line has an optical thickness
for these
parameters, the HCO+ 3-2 line has an optical thickness
![]() 1
for an HCO+ column density of
1
for an HCO+ column density of
![]() cm-2 and a
line width of 1 km s-1. Secondly, we can estimate what density,
cm-2 and a
line width of 1 km s-1. Secondly, we can estimate what density,
![]() is required to reach that optical thickness in a
free-falling envelope with a power-law density profile,
is required to reach that optical thickness in a
free-falling envelope with a power-law density profile,
![]() at a size scale of 100 AU corresponding to the
region where the disk potentially forms, i.e., by simply estimating
at a size scale of 100 AU corresponding to the
region where the disk potentially forms, i.e., by simply estimating
![]() from
from
|
(A.1) |
with
Appendix B: Summary of observed Class I sources
B.1 IRS 43
IRS 43 (YLW15; Young et al. 1986) has been the target of numerous
studies across the full wavelength range. At radio wavelengths, IRS 43
is resolved into two separate components, YLW15-VLA1 and -VLA2 with a
separation of 0.6
![]() (Girart et al. 2000). From multi-epoch high
angular resolution radio data, these binary components were found to
show relative proper motions indicative of orbital motions in a
1.7
(Girart et al. 2000). From multi-epoch high
angular resolution radio data, these binary components were found to
show relative proper motions indicative of orbital motions in a
1.7 ![]() total mass binary
(Curiel et al. 2003). Girart et al. found that one of the two
components, VLA1, were resolved in observations at 3.6 and 6 cm with
the VLA with a deconvolved size of about 0.4
total mass binary
(Curiel et al. 2003). Girart et al. found that one of the two
components, VLA1, were resolved in observations at 3.6 and 6 cm with
the VLA with a deconvolved size of about 0.4
![]() along its major
axis and suggested that it was associated with a thermal radio jet. In
addition, IRS 43 is a peculiar X-ray emitter showing quasi-periodic
X-ray flares (Tsuboi et al. 2000) consistent with magnetic shearing and
reconnection between the central star and an accretion disk, with the
period suggesting a mass of the central star in the range
1.8-2.2
along its major
axis and suggested that it was associated with a thermal radio jet. In
addition, IRS 43 is a peculiar X-ray emitter showing quasi-periodic
X-ray flares (Tsuboi et al. 2000) consistent with magnetic shearing and
reconnection between the central star and an accretion disk, with the
period suggesting a mass of the central star in the range
1.8-2.2 ![]() (Montmerle et al. 2000).
(Montmerle et al. 2000).
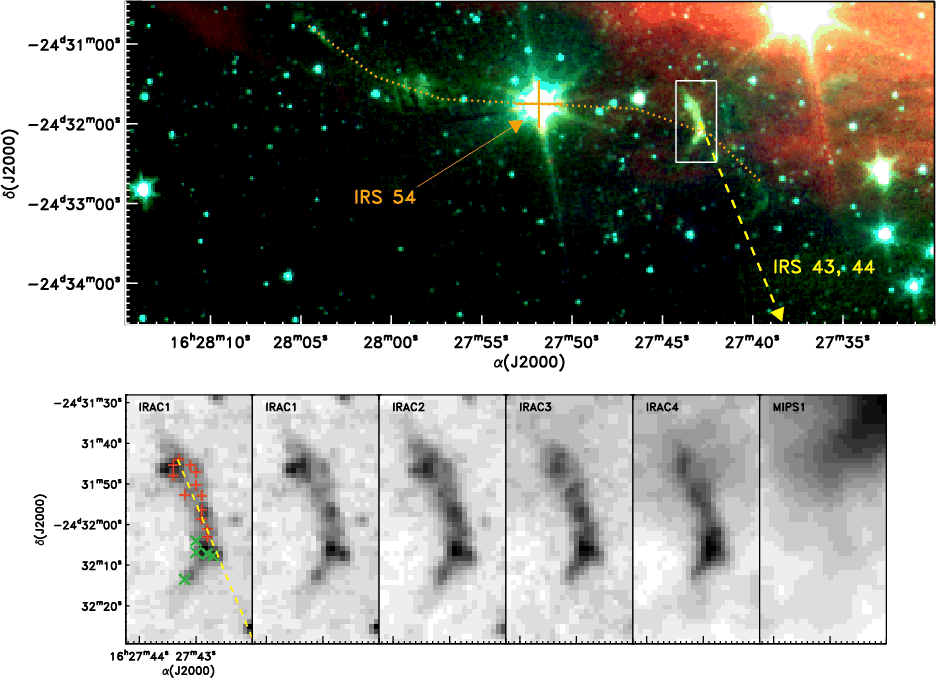
The region was imaged in the near-infrared by Grosso et al. (2001) who discovered a set of ``embedded'' Herbig-Haro objects, well aligned with the thermal jet candidate from the centimeter observations of Girart et al. (2000). Spitzer Space Telescope images of the embedded Herbig-Haro objects (Fig. B.1) show the knots clearly along a line pointing directly back toward the group of objects where IRS 43 and another embedded protostar, IRS 44, is located. As also pointed out by Grosso et al., the association of the Herbig-Haro knots to IRS 43 is not unique: the nearby protostar, IRS 54 (see also Sect. B.5), also drives a large-scale, precessing outflow clearly seen in the Spitzer images in Fig. B.1.
The dotted lines in Fig. B.1 show the propagation of
the IRS 54 outflow, following the H2 emission in the eastern lobe
and assuming that the precession of the IRS 54 outflow is symmetric
around the protostar - thereby giving the expected location of the
western lobe. The western lobe in this case passes through the
location of the southern part of the near-infrared Herbig-Haro
objects: based on their morphologies in the higher resolution
near-infrared images, Grosso et al. (2001) suggested that these knots
(crosses in the lower left panel of Fig. B.1) are
indeed caused by the IRS 54 outflow with the northern knots (plus
signs in the lower left panel of Fig. B.1 related to
the IRS 43 outflow - the lower spatial resolution Spitzer images do
not reveal this distinction clearly, though. Some support for the
interpretation of Grosso et al. can be taken from the
morphology of another bow-shock seen in the Spitzer images at
![]() to the west of the near-infrared Herbig-Haro
knots. Together with the near-infrared Herbig Haro knots detected by
Grosso et al., this bow-shock is on the southern side of the
dashed-line suggesting that the dashed line indeed is delineating the
northern edge of the western lobe (and the southern edge of the
eastern lobe) of the IRS 54 outflow. It is also possible that another
source in the group encompassing IRS 43 could be responsible for the
Herbig-Haro knots: the main argument for the association to IRS 43 is
the coincidence with the radio jet and the identification of a
bow-shock south of IRS 43 in the near-infrared, possibly representing
the counter-jet (Grosso et al. 2001; Girart et al. 2000,2004).
to the west of the near-infrared Herbig-Haro
knots. Together with the near-infrared Herbig Haro knots detected by
Grosso et al., this bow-shock is on the southern side of the
dashed-line suggesting that the dashed line indeed is delineating the
northern edge of the western lobe (and the southern edge of the
eastern lobe) of the IRS 54 outflow. It is also possible that another
source in the group encompassing IRS 43 could be responsible for the
Herbig-Haro knots: the main argument for the association to IRS 43 is
the coincidence with the radio jet and the identification of a
bow-shock south of IRS 43 in the near-infrared, possibly representing
the counter-jet (Grosso et al. 2001; Girart et al. 2000,2004).
|
Figure B.1:
Upper panel: the region of the IRS 54 outflow as well
as the near-infrared Herbig-Haro objects from Spitzer observations
with 3.6 |
| Open with DEXTER | |
We detect IRS 43 in both HCO+ 3-2, HCN 3-2 and continuum. The HCN and HCO+ 3-2 emission is elongated in the W/NW-E/SE direction with a clear velocity gradient along its major axis. The major axis of the HCO+ and HCN 3-2 emission is close to the axis of the continuum emission - and perpendicular to the direction toward the Herbig-Haro objects (Fig. B.1; Grosso et al. 2001) and the thermal continuum jet (Girart et al. 2000).
B.2 TMR1 and TMC1A
Images of TMR1 using the HST/NICMOS at 1.6-2.1Both TMR1 and TMC1A are detected in continuum, together with HCO+and HCN 3-2. Both show clear evidence of the line emission being offset from the continuum peaks toward the outflow nebulosity observed in the near-infrared HST/NICMOS images - similar to the case for GSS30-IRS1. The offsets in the HCO+ 3-2 emission toward the two sources are similar to those observed in HCO+ 1-0 by Hogerheijde et al. (1998).
B.3 GSS30
The GSS30 region is the most complex of the studied fields associated with a clear near-infrared nebulosity. At least three young stellar objects (GSS30-IRS1, -IRS2 and -IRS3) are seen at infrared wavelengths, located within the SMA primary beam field of view, (Weintraub et al. 1993) and observed by Spitzer (e.g., Jørgensen et al. 2008). GSS30-IRS1 is located at the center of this outflow cone and has a mid-infrared SED slope consistent with a Class I protostar. GSS 30-IRS3 (LFAM1) was detected in high-resolution images at 2.7 mm (Zhang et al. 1997) and 6 cm (Leous et al. 1991). GSS30-IRS2 is likely a more evolved (T Tauri) young stellar object also detected at 6 cm.
The SMA continuum observations identify one protostar GSS30-IRS3
(LFAM1) whereas the two other protostars remain undetected down to the
noise level of ![]() 3 mJy beam-1. The same was the case for
the similar in the 2.7 mm observations by Zhang et al. (1997). The
single-dish continuum emission toward GSS30 is often attributed solely
to GSS30-IRS1 (e.g., Zhang et al. 1997), but appears to be peaking at
GSS30-IRS3 consistent with the suggestion that this source is more
deeply embedded.
3 mJy beam-1. The same was the case for
the similar in the 2.7 mm observations by Zhang et al. (1997). The
single-dish continuum emission toward GSS30 is often attributed solely
to GSS30-IRS1 (e.g., Zhang et al. 1997), but appears to be peaking at
GSS30-IRS3 consistent with the suggestion that this source is more
deeply embedded.
The HCO+ line emission shows a distinct peak at the location of GSS30-IRS1 with a narrow line detected toward GSS30-IRS2 (Fig. 4). HCN is also clearly detected toward GSS30, again toward GSS30-IRS1, but offset from the HCO+ 3-2 emission. Toward IRS1, both HCO+ and HCN appear to trace one side of the outflow cone directed toward us.
B.4 WL 12
WL 12 is a ``standard'' Class I YSO: it is neither a binary, nor does it have a spectacular outflow. It is clearly detected in the interferometric continuum data, but not in the HCO+ or HCN 3-2 maps. It is identified as a core in SCUBA maps and included in the list of embedded YSOs by Jørgensen et al. (2008) with red mid-infrared colors characteristic of those sources, as well as bright HCO+ 4-3 emission (van Kempen et al. 2009).
B.5 IRS 54
IRS 54 is found to be a binary with a separation of about 7B.6 IRS 63 and Elias 29
The results for IRS 63 and Elias 29 are discussed in more detail in
Lommen et al. (2008). In summary, the two sourcesare detected in both
continuum and HCO+ 3-2. IRS 63 shows the strongest continuum
emission by about a factor 8 whereas the Elias 29 is stronger in
HCO+ 3-2 also by about a factor 8. Where Elias 29 clearly is
associated with strong extended continuum emission, witnessed
both by its brightness profile in the SMA data and by comparison to
single-dish observations, IRS 63 is dominated by emission from a
compact, unresolved component, consistent with the suggestion that it
is a source in transition between the embedded and T Tauri stages with
![]() .
.
Current usage metrics show cumulative count of Article Views (full-text article views including HTML views, PDF and ePub downloads, according to the available data) and Abstracts Views on Vision4Press platform.
Data correspond to usage on the plateform after 2015. The current usage metrics is available 48-96 hours after online publication and is updated daily on week days.
Initial download of the metrics may take a while.