| Issue |
A&A
Volume 502, Number 1, July IV 2009
|
|
|---|---|---|
| Page(s) | 85 - 90 | |
| Section | Extragalactic astronomy | |
| DOI | https://doi.org/10.1051/0004-6361/200912053 | |
| Published online | 27 May 2009 | |
Online Material
Table 2: X-ray, optical and near-infrared properties of the initial candidates.
![\begin{figure}
\par\includegraphics[width=17cm,clip]{12053f1a.eps}
\end{figure}](/articles/aa/olm/2009/28/aa12053-09/img121.png) |
Figure 1: Optical (R) images of the normal galaxy candidates, centred on the X-ray position. The inner radii of the crosses are 6 arcsec and the outer 30 arcsec. |
| Open with DEXTER | |
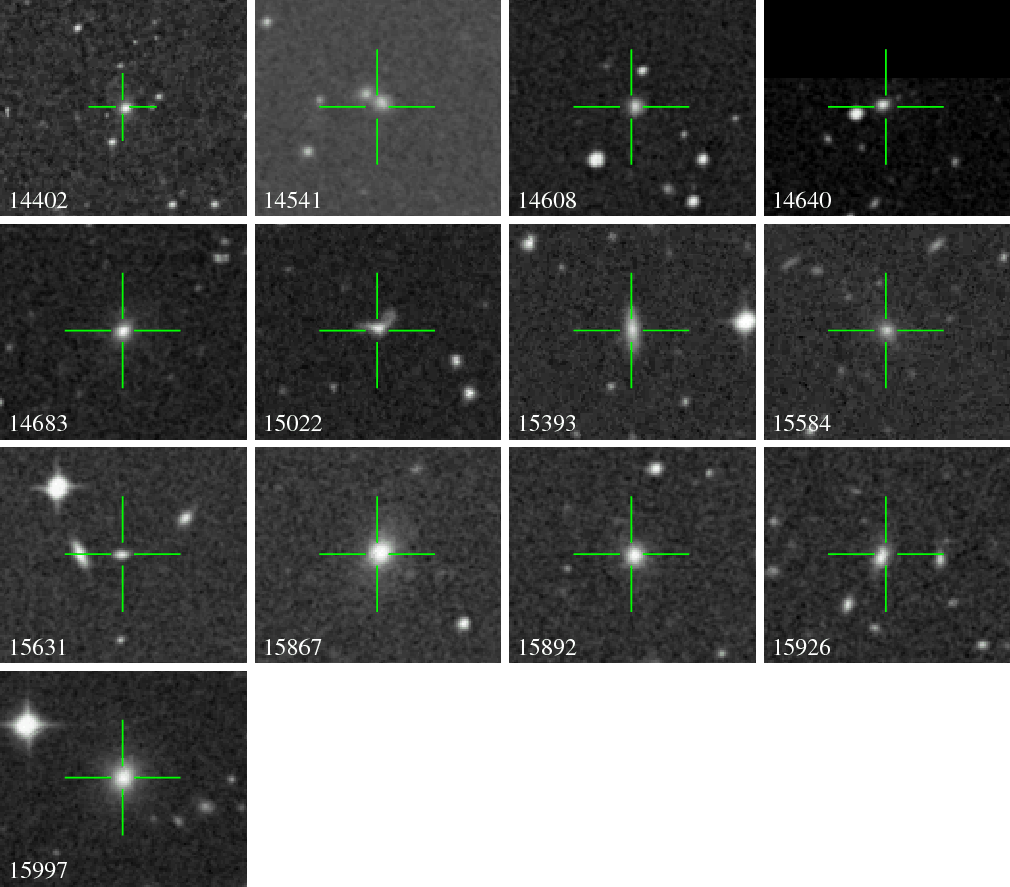 |
Figure 1: continued. |
| Open with DEXTER | |
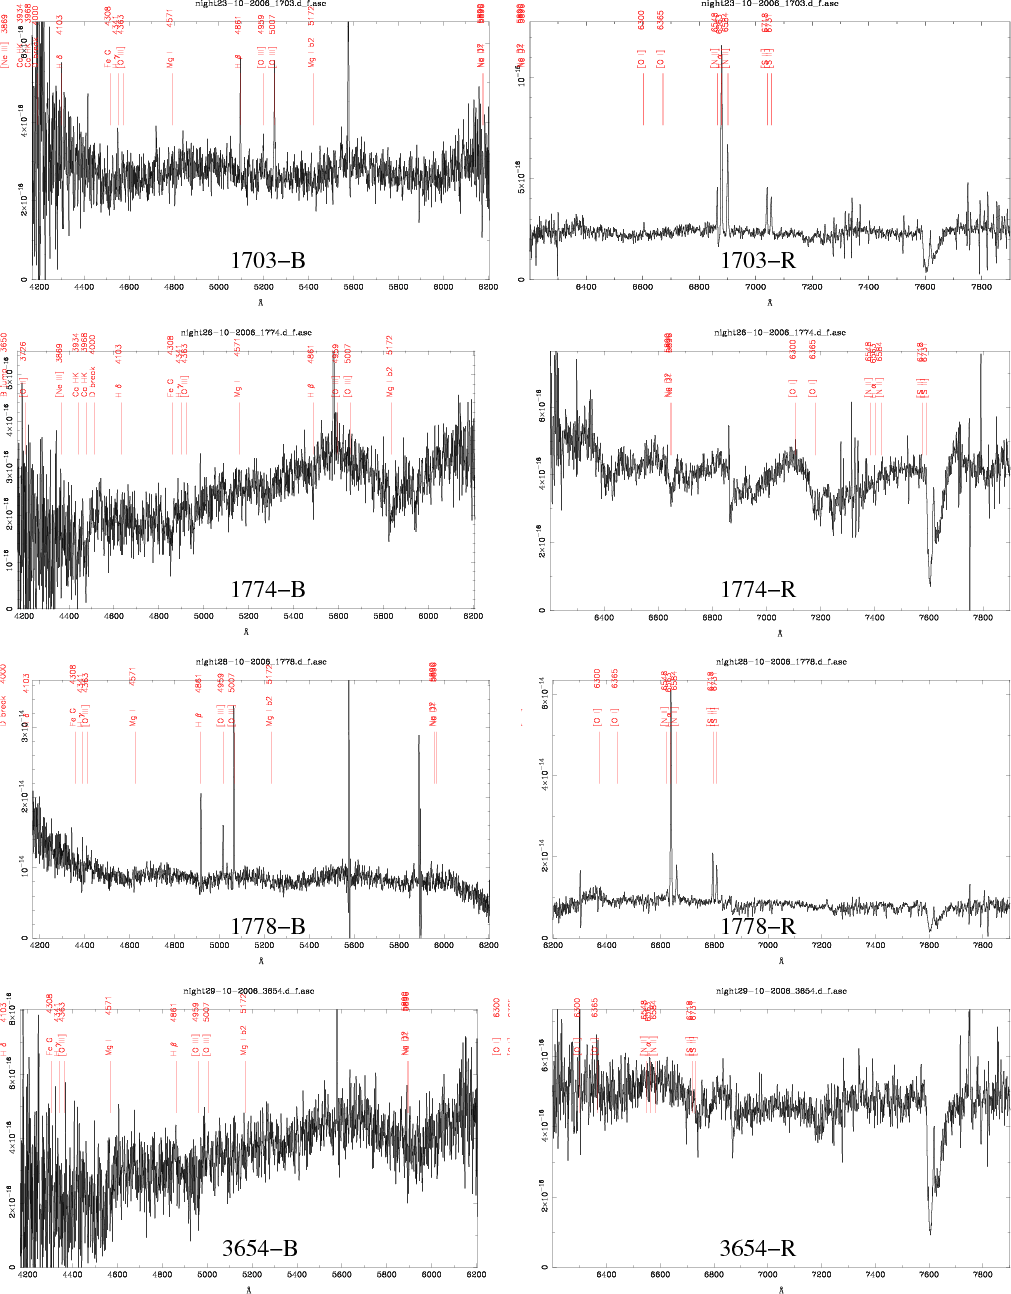 |
Figure 3: Optical spectra of the normal galaxy candidates. |
| Open with DEXTER | |
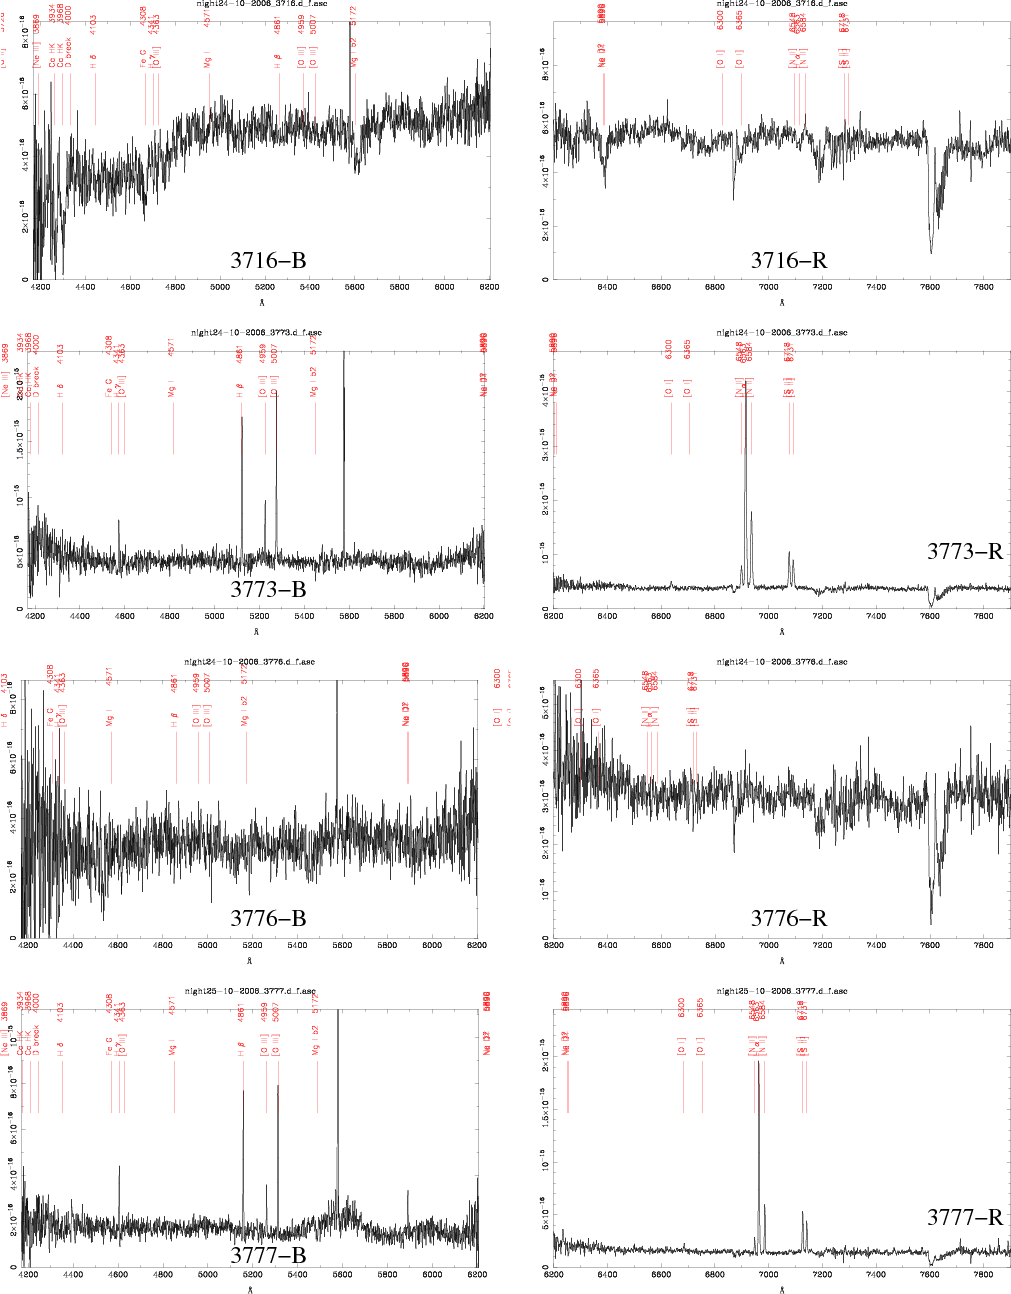 |
Figure 3: continued. |
| Open with DEXTER | |
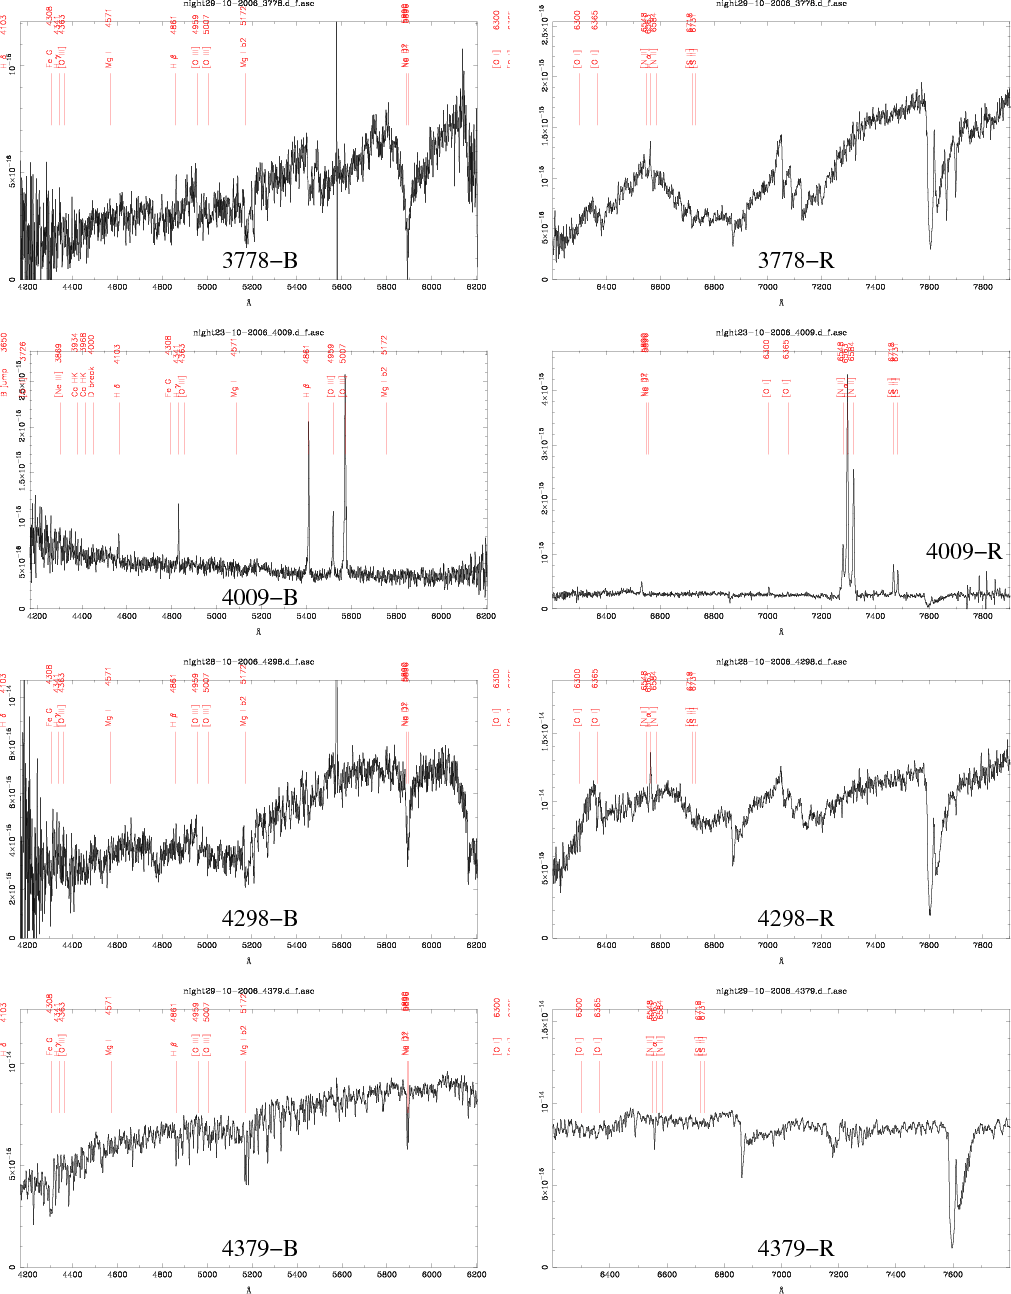 |
Figure 3: continued. |
| Open with DEXTER | |
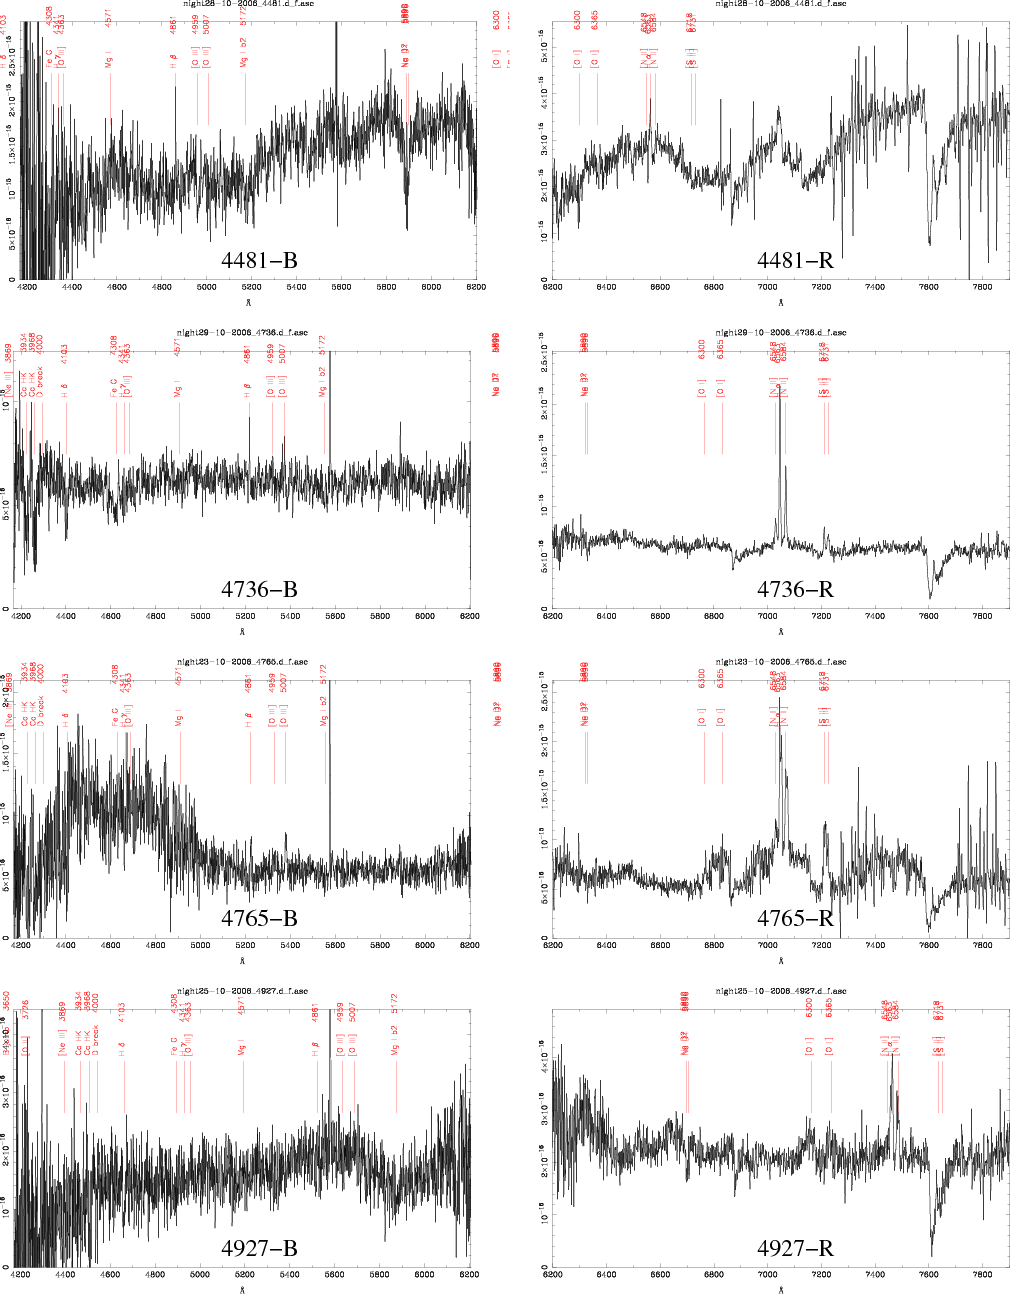 |
Figure 3: continued. |
| Open with DEXTER | |
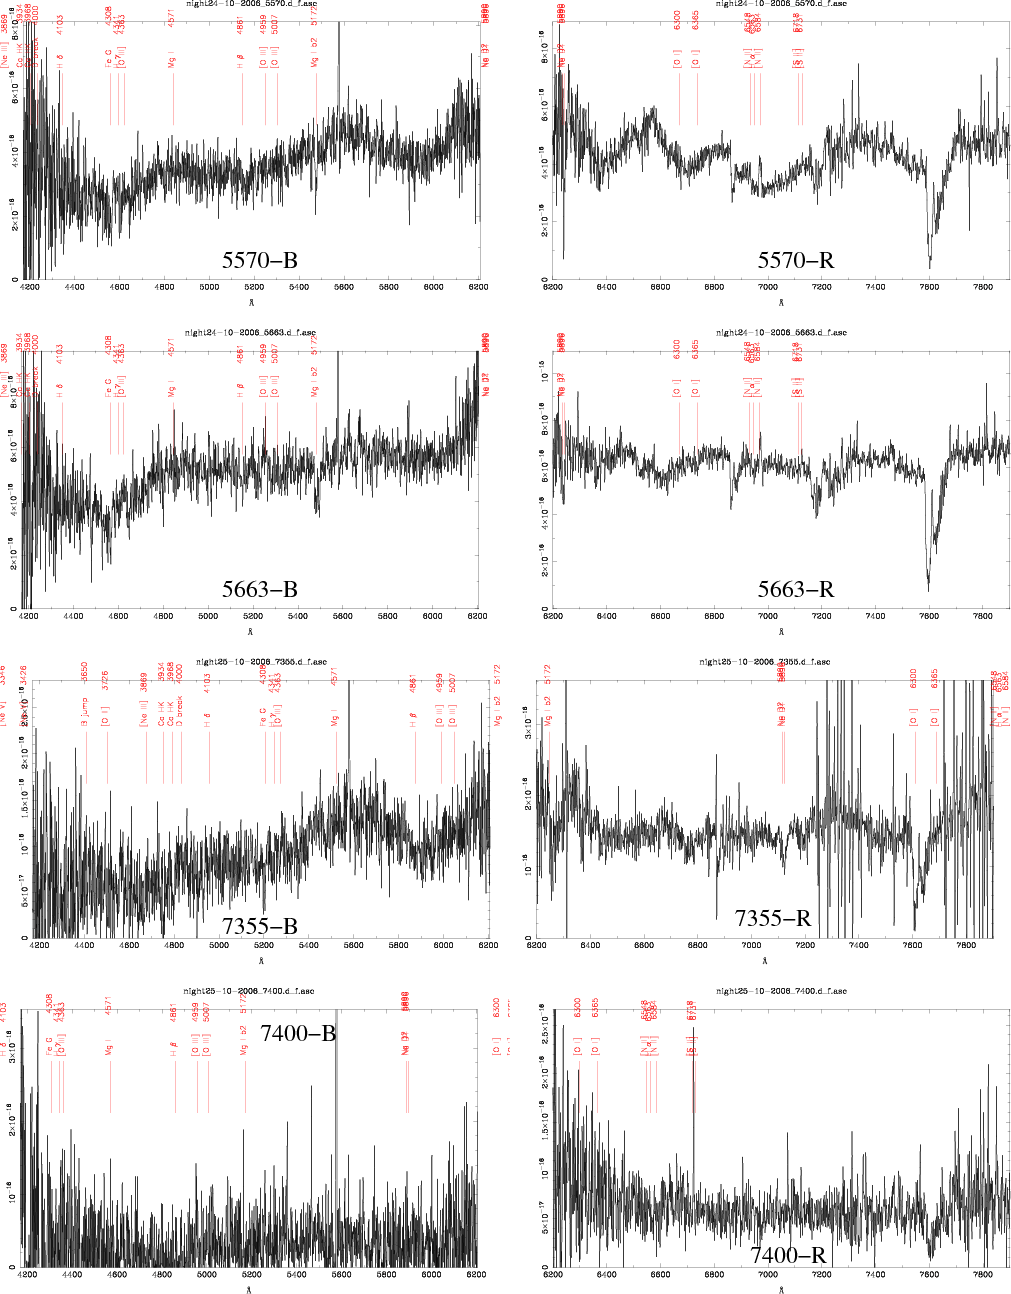 |
Figure 3: continued. |
| Open with DEXTER | |
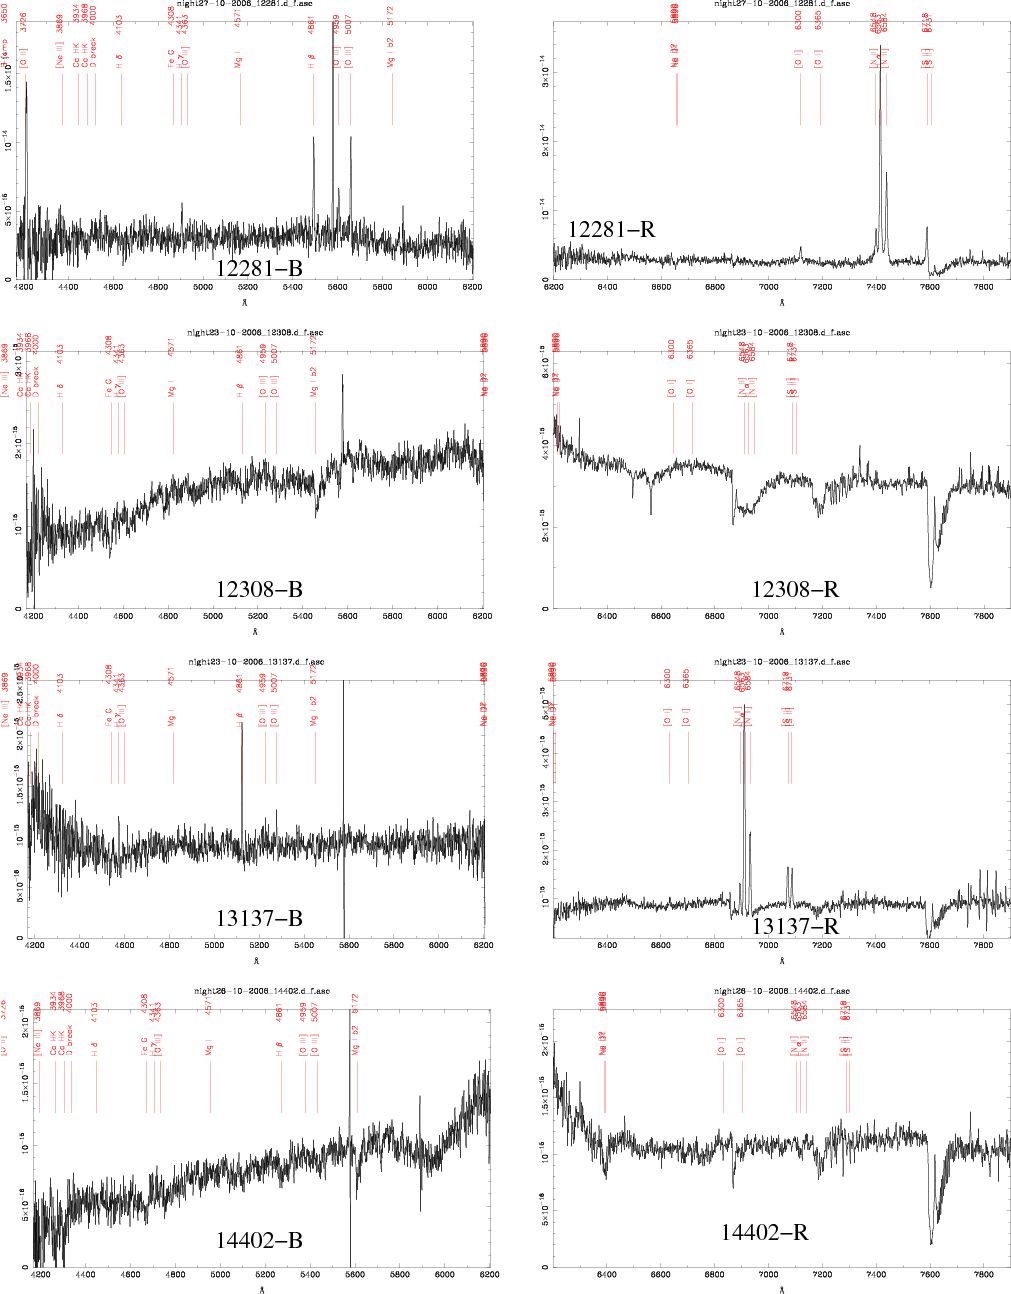 |
Figure 3: continued. |
| Open with DEXTER | |
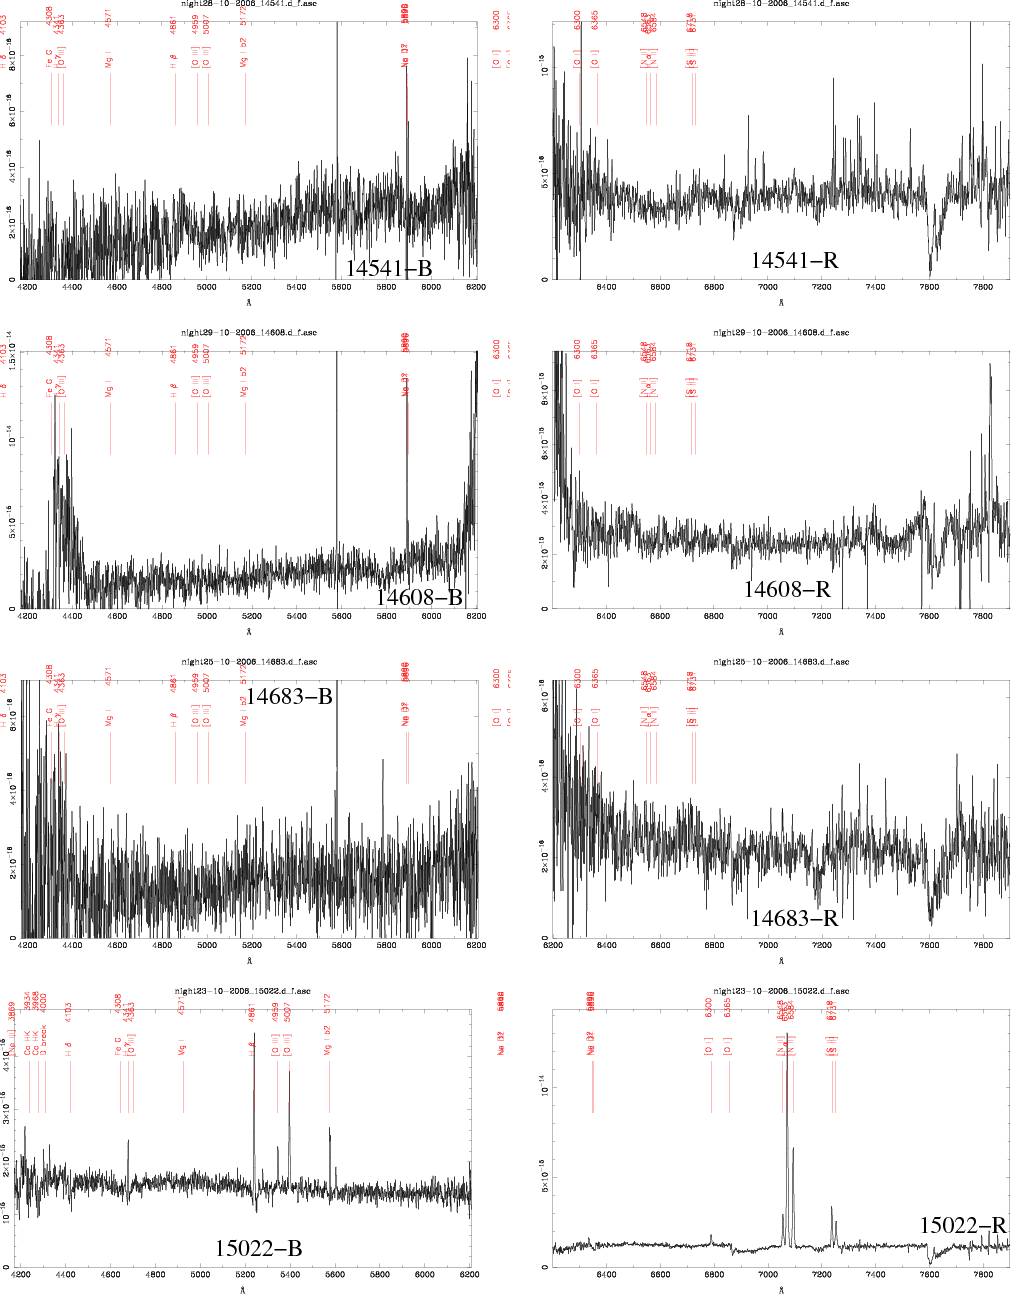 |
Figure 3: continued. |
| Open with DEXTER | |
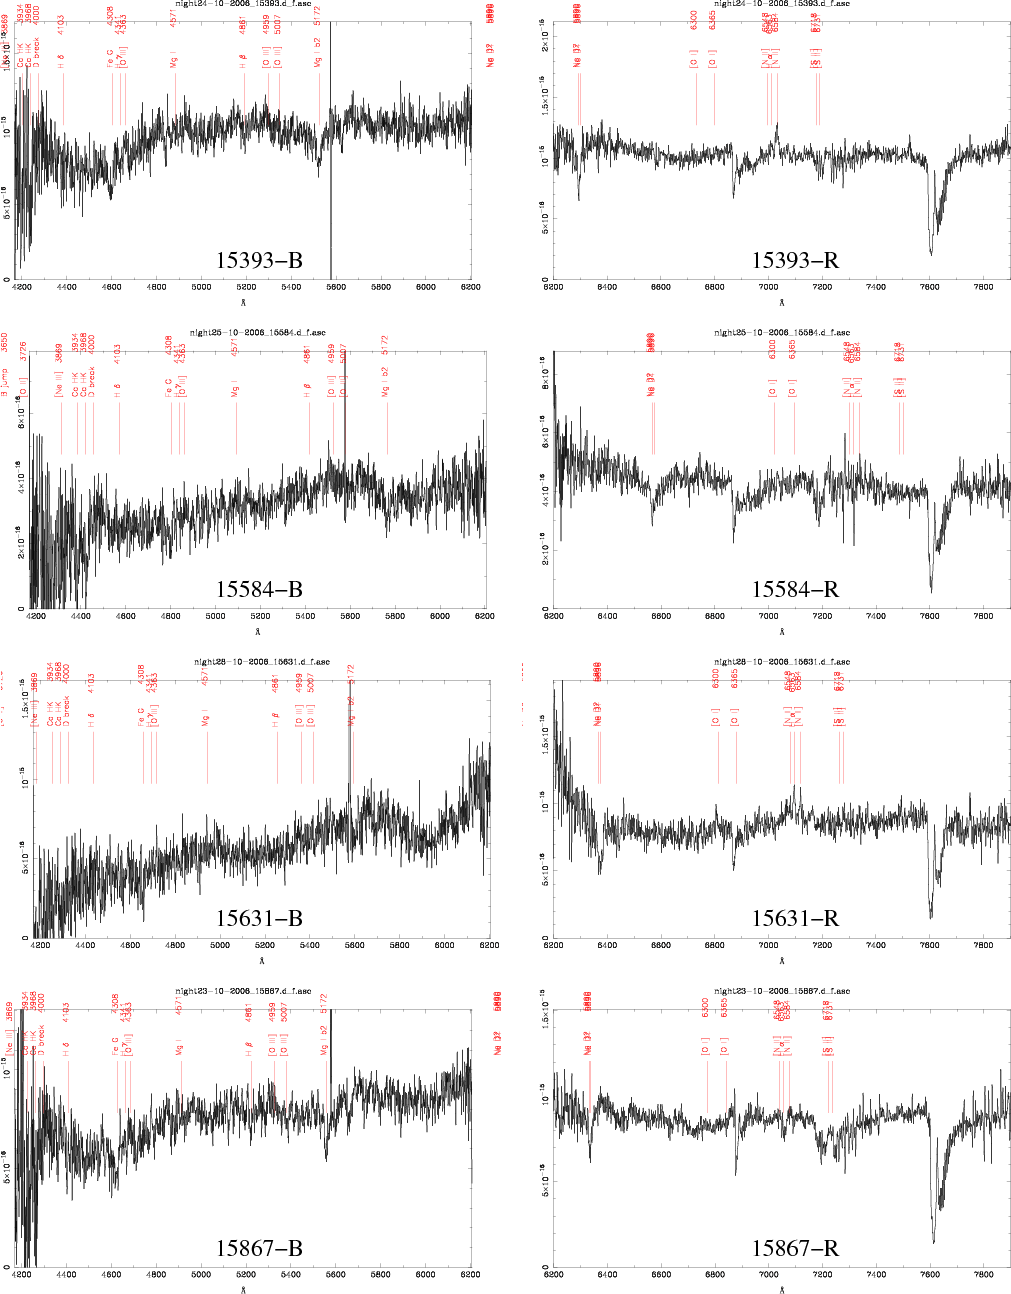 |
Figure 3: continued. |
| Open with DEXTER | |
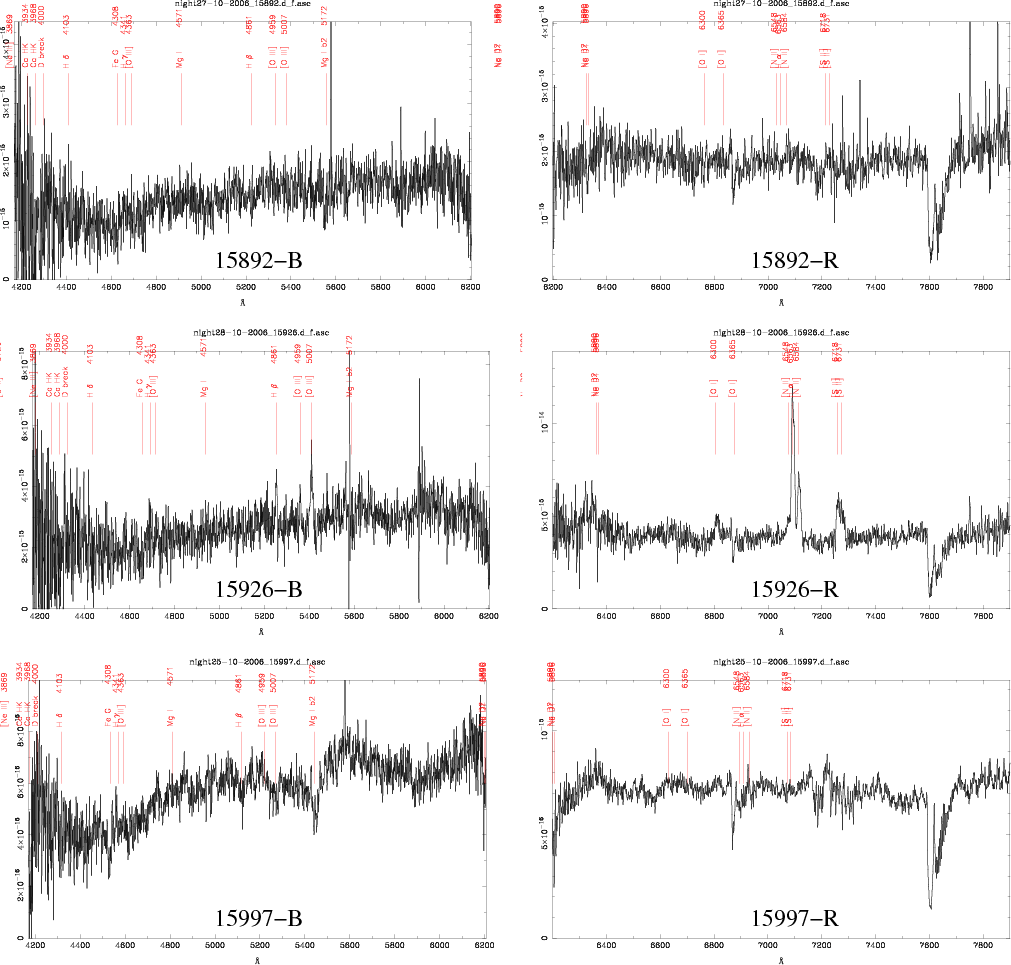 |
Figure 3: continued. |
| Open with DEXTER | |
Current usage metrics show cumulative count of Article Views (full-text article views including HTML views, PDF and ePub downloads, according to the available data) and Abstracts Views on Vision4Press platform.
Data correspond to usage on the plateform after 2015. The current usage metrics is available 48-96 hours after online publication and is updated daily on week days.
Initial download of the metrics may take a while.