


| Issue |
A&A
Volume 712, August 2026
|
|
|---|---|---|
| Article Number | C2 | |
| Number of page(s) | 4 | |
| Section | Catalogs and data | |
| DOI | https://doi.org/10.1051/0004-6361/202661646e | |
| Published online | 30 July 2026 | |
Flaires
A comprehensive catalog of dust echo-like infrared flares (Corrigendum)
1
Deutsches Elektronen Synchrotron DESY,
Platanenallee 6,
15738
Zeuthen,
Germany
2
Institut für Physik, Humboldt-Universität zu Berlin,
12489
Berlin,
Germany
3
Fakultät für Physik & Astronomie, Ruhr-Universität Bochum,
44780
Bochum,
Germany
4
Leiden Observatory, Leiden University,
Postbus 9513,
2300
RA,
Leiden,
The Netherlands
★ Corresponding author: This email address is being protected from spambots. You need JavaScript enabled to view it.
Key words: accretion, accretion disks / catalogs / galaxies: active / infrared: galaxies / errata, addenda
Equation (7) was missing a factor of 2 in the analysis code. This led to an overestimation of the blackbody radius, Reff, by a factor of ![Mathematical equation: $\[\sqrt{2}\]$](/articles/aa/full_html/2026/08/aa61646e-26/aa61646e-26-eq1.png) , and an overestimation of the bolometric blackbody luminosities, Lbol, by a factor of 2. The measured temperatures are not affected, so the qualitative evolution of the light curves remains unchanged (see Figs. 3 and 4). However, because the Markov chain Monte Carlo (MCMC) fits rely on random moves in the parameter space, for 85 objects (around 10% of the sample) fits for up to two epochs converged where they had not before, and vice versa. As this occurred for the epochs where the flare is barely detectable, the peak bolometric luminosity was mostly unaffected. However, because the bolometric energy is a sum over the measured luminosities (Eq. (8)), for these objects it changed beyond the expected factor of 0.5. For 14 objects, the peak time of the bolometric luminosity also changed as a result. The exact changes per column are listed in Table 1.
, and an overestimation of the bolometric blackbody luminosities, Lbol, by a factor of 2. The measured temperatures are not affected, so the qualitative evolution of the light curves remains unchanged (see Figs. 3 and 4). However, because the Markov chain Monte Carlo (MCMC) fits rely on random moves in the parameter space, for 85 objects (around 10% of the sample) fits for up to two epochs converged where they had not before, and vice versa. As this occurred for the epochs where the flare is barely detectable, the peak bolometric luminosity was mostly unaffected. However, because the bolometric energy is a sum over the measured luminosities (Eq. (8)), for these objects it changed beyond the expected factor of 0.5. For 14 objects, the peak time of the bolometric luminosity also changed as a result. The exact changes per column are listed in Table 1.
The conclusions about the nature of the transients are not affected: the evolution of the blackbody radius, temperature, and luminosity remain consistent with cooling dust after illumination by Tidal Disruption Event (TDE) emission (Fig. 5). The energy remains in the range of 1051–1052 erg (Fig. 6), consistent with the energy output of a TDE, assuming a covering factor of fc ≳ 0.1, the disruption of a solar mass star, subsequent accretion of half its mass, and a dissipation efficiency of ϵ ≈ 0.1. The comparison between the blackbody radius at peak, Reff,peak, and the radius derived from the light curve, RLC, now fall even better in the parameter space for the width of the activating flare 𝒪(10 d) < ΔTopt < 𝒪(100 d) (Fig. 7) expected for TDEs. The correlations between the dust radius, temperature, measured energy, and luminosity did not change significantly (Fig. 8).
After changing the luminosity completeness threshold from 6 × 1043 erg s−1 to 3 × 1043 erg s−1, as expected for a missing factor of 2, the implications for the transient rate and its evolution with redshift remain unaffected. For completeness, the updated Figs. 10, 11, and 12 are also shown below.
Data availability
The updated Table A.1 is available at the CDS via https://cdsarc.cds.unistra.fr/viz-bin/cat/J/A+A/712/C2.
Acknowledgements
We thank Hui Liu for detailed comparisons of the dust echo in SDSS J010320.39+140152.5 that helped us discover the erroneous code.
© The Authors 2026
 Open Access article, published by EDP Sciences, under the terms of the Creative Commons Attribution License (https://creativecommons.org/licenses/by/4.0), which permits unrestricted use, distribution, and reproduction in any medium, provided the original work is properly cited.
This article is published in open access under the Subscribe to Open model. This email address is being protected from spambots. You need JavaScript enabled to view it. to support open access publication.
All Tables
All Figures
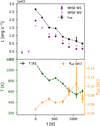 |
Fig. 4 Light curve and evolution of Reff and T for NGC 7392. The crosses mark the best-fit values of the visits where the MCMC sampling did not result in a meaningful constraint of Lbol. |
| In the text | |
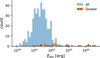 |
Fig. 6 Distribution of the total emitted energy, assuming hot dust. The quasars are identified by a match to Milliquas. |
| In the text | |
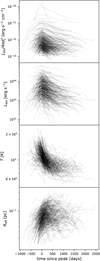 |
Fig. 5 Parameters from the blackbody fits for 449 sources where at least two epochs have a good fit. The time is given in the source frame. First panel: bolometric flux based on the bolometric luminosity and the luminosity distance. Second panel: bolometric luminosity. Third and fourth panel: temperature and effective radius. |
| In the text | |
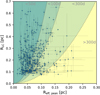 |
Fig. 7 Dust radius estimated from the IR light curve, RLC, against the radius at the peak, Reff, peak, obtained from the blackbody fits. The colored contours represent the actual blackbody radius for a finite width of the initial O/UV transient. |
| In the text | |
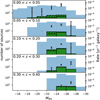 |
Fig. 10 Rate as a function of the absolute magnitude in W1 and redshift. The light blue histogram shows the total number of galaxies in the parent galaxy sample, and the green histogram shows the host of our flare sample. The black-hatched bars represent flares with Lbol, peak < 3 × 1043 erg. The gray data points and black error bars show the rate as calculated with Eq. (12). The gray triangles represent the 90% upper limit on the rate where no flare was observed. The errors are statistical only. |
| In the text | |
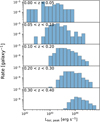 |
Fig. 11 Distribution of the maximum bolometric luminosity as a function of redshift. |
| In the text | |
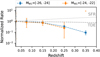 |
Fig. 12 Evolution of the rate with redshift for the two MW1 bins with flares in the first and at least one other redshift bin, normalized to the first redshift bin. The open symbols represent upper limits. The redshift evolution of the star formation rate (SFR) and for the TDEs is shown for comparison. |
| In the text | |
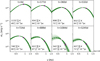 |
Fig. 3 Blackbody fits for NGC 7392 for all epochs of the flare where the MCMC sampling resulted in meaningful constraints on the fit parameters. The dashed green line shows the best fit, and the transparent lines show the results from the MCMC sampling. The best fit and 68th percentile temperature and effective radius values are shown in the bottom left corner. The frequency, ν, is given in the source frame. |
| In the text | |
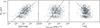 |
Fig. 8 Correlation of the total emitted bolometric energy Ebol, the peak bolometric luminosity, Lbol, peak, and the dust radius inferred from the light curve RLC. The dashed lines represent the theoretically expected relations. |
| In the text | |
Current usage metrics show cumulative count of Article Views (full-text article views including HTML views, PDF and ePub downloads, according to the available data) and Abstracts Views on Vision4Press platform.
Data correspond to usage on the plateform after 2015. The current usage metrics is available 48-96 hours after online publication and is updated daily on week days.
Initial download of the metrics may take a while.