


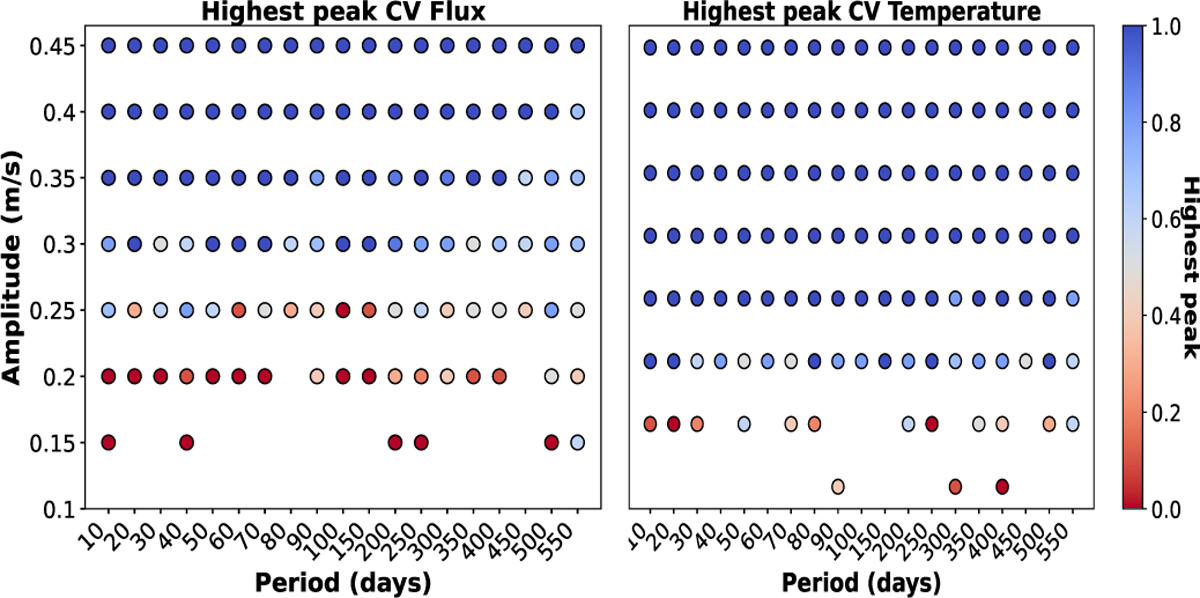
Fig. A.3
Download original image
Neural-network models using the CV strategy. Here, we assess whether the detected planetary signal corresponds to the dominant peak in the periodogram across ten independent realizations with different random phase injections, for both flux- and temperature-based representations. The color bar indicates the fraction of realizations in which the injected signal is recovered as the dominant peak: a value of 1 (dark blue) corresponds to ten total successful recoveries, while zero (dark red) indicates that the injected signal is not recovered as the dominant peak in any realization.
Current usage metrics show cumulative count of Article Views (full-text article views including HTML views, PDF and ePub downloads, according to the available data) and Abstracts Views on Vision4Press platform.
Data correspond to usage on the plateform after 2015. The current usage metrics is available 48-96 hours after online publication and is updated daily on week days.
Initial download of the metrics may take a while.