


Fig. 6
Download original image
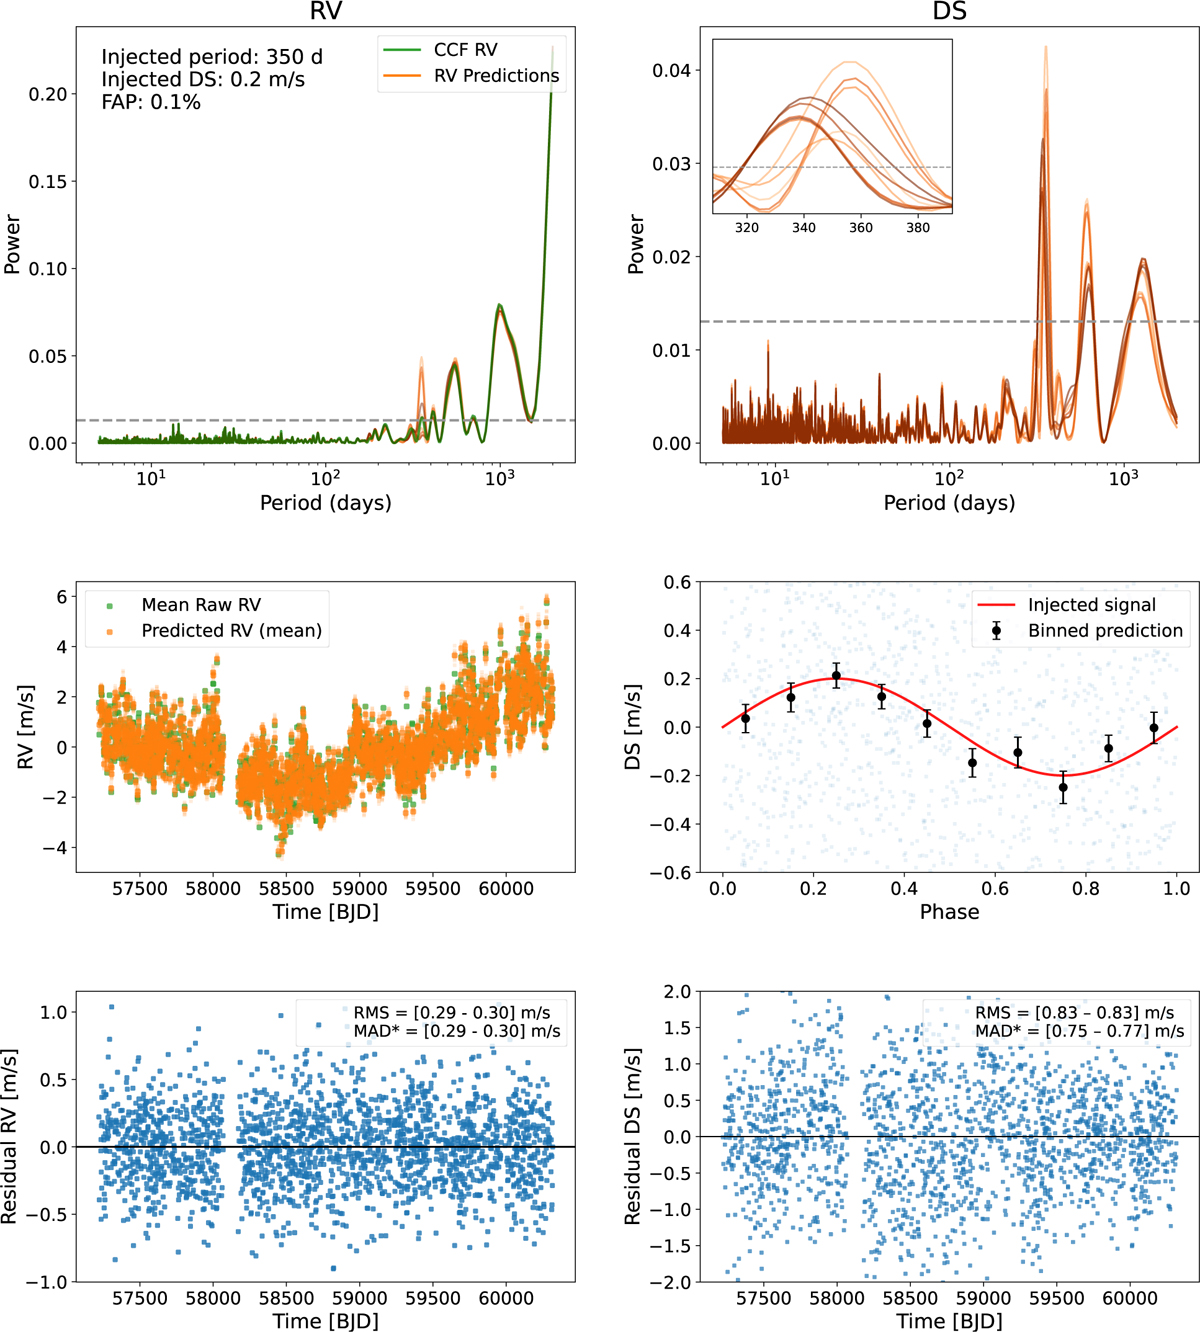
Example of a 20 cm/s planetary signal recovery using the CV-Temp based model. Top: periodograms of the mean raw CCF RVs (left) and the predicted DSs (right), with the dashed line indicating the 0.1% FAP threshold. The injected period at 350 days is clearly detected in the DS periodogram, while it remains obscured in the RVs. Middle: time series of the mean raw RVs (left) and the phase-folded DS predictions (right), where the black points represent the mean value within the phase bins and the error bars correspond to the standard error of the mean within each bin. For clarity, the y-axis range is restricted in the phase-folded panel; the full dispersion of the predictions is shown in the residual panel. Bottom: corresponding residuals, illustrating that, although individual DS predictions exhibit substantial scatter, the residuals remain centered around zero without a clear systematic structure.
Current usage metrics show cumulative count of Article Views (full-text article views including HTML views, PDF and ePub downloads, according to the available data) and Abstracts Views on Vision4Press platform.
Data correspond to usage on the plateform after 2015. The current usage metrics is available 48-96 hours after online publication and is updated daily on week days.
Initial download of the metrics may take a while.